Introduction
This is the first of a two part series on monitoring a Kafka cluster. It looks at how a cluster can be monitored, focusing in this part on using the Conduktor Platform to surface and view the metrics. A companion Spring Boot application forms the basis of demonstrating exporting of metrics and surfacing them in Conduktor.
In the second part Kafka Monitoring & Metrics: With Confluent Control Center, the focus is on using Confluent Control Center, another Kafka monitoring tool, looking at how it can be incorporated in the Component Test Framework for ease of testing, monitoring and tuning.
The source code for the Spring Boot demo application is available here.
Monitoring
Monitoring a Kafka cluster is a vital part of Operations, ensuring it is healthy and functioning as required. With the right monitoring in place broker issues can be diagnosed, with alerting giving immediate notification of issues. The broker exposes many metrics via Java Management Extensions (JMX) which can be captured by a collection agent and surfaced in the monitoring tool.
Conduktor
The Conduktor Platform provides many tools and services covering all aspects of a Kafka installation. The Kafka: Conduktor Platform & Kafka Component Testing article covered one of these services, the Console, that allows the user to explore their broker configuration, its topics and the messages flowing through the system. Conduktor also offers a Monitoring tool, a UI that displays metrics, and is the focus of this article.
Whilst there are many metrics available, Conduktor aims to surface the key metrics out of the box. This is to ensure that issues do not get lost in the noise. These include under-replicated partitions and partitions not meeting the the minimum in-sync replica requirement (covered in detail in the Kafka Replication & Min In-Sync Replicas article. Along with this, partition counts, offline partitions and message rates are useful for diagnosing unbalanced load and resource issues. Administrators are able to configure exactly which metrics they then value for display in the UI.
For the latest on Conduktor, head over to conduktor.io.
Spring Boot Demo Application
Overview
The Spring Boot application provides a simple harness for sending and receiving events to and from Kafka. This facilitates demonstrating the monitoring of the resulting metrics in Conduktor that are exported by the Kafka service. The brokers, topics and application can then be configured and tuned to observe the upshot on the system.
The application provides a REST endpoint that accepts a request to trigger sending events. Either the number of events to produce, or the period of time over which to produce events, can be specified. The actual events have a random payload, and the payload size is specified in the REST request. The application first writes the events to a topic, before then consuming them from this topic.
The Kafka cluster, Zookeeper, and Conduktor Platform are spun up in Docker containers using the Docker Compose tool, and the Spring Boot application is run as an executable jar file.

The demo-topic has five partitions, with the lead replicas typically split across the three broker nodes. The topic is configured with a replication factor of 3, so each partition has two follower replicas on the other two broker nodes. For simplicity the diagram just shows the demo instance writing to one of the lead replicas, the data being replicated to its two followers, and the service consuming from one of the followers. In actual fact the service instance is writing data to each of the five lead replicas all of which are replicated across the cluster, and likewise consuming from five replicas for each partition.

The user of the system POSTs a request to the service via curl to trigger sending events.

The service produces the requested number of events to each of the five lead partition replicas for the topic.

The data is replicated to the follower partition replicas across the broker nodes.

The service consumes the events from a replica partition for each partition of the five partitions.

Conduktor gathers the exported metrics from the broker nodes and topics.

The user of the system monitors the metrics in the Conduktor Platform web application.
Configuration
In order to export metrics from the Kafka cluster a monitoring agent must be installed and used when starting the Kafka service. As the Kafka service is being started in a Docker container, the agent and configuration file must be added to bind mounts on the Kafka containers.
The agent is the jmx_prometheus_javaagent. This is not part of the demo repo and should first be downloaded. From the project root directory download with:
curl https://repo1.maven.org/maven2/io/prometheus/jmx/jmx_prometheus_javaagent/0.17.2/jmx_prometheus_javaagent-0.17.2.jar -o ./jmx_prometheus_javaagent-0.17.2.jarThe example monitoring configuration file kafka-broker.yml, is provided by Conduktor, and is included in the project root directory.
With these in place, the docker-compose file is configured to add the volumes. e.g.
volumes:
   - type: bind
     source: "./jmx_prometheus_javaagent-0.17.2.jar"
     target: /opt/jmx-exporter/jmx_prometheus_javaagent-0.17.2.jar
     read_only: true
   - type: bind
     source: "./kafka-broker.yml"
     target: /opt/jmx-exporter/kafka-broker.yml
     read_only: true
The agent is started by adding the following to the docker-compose environment configuration:
KAFKA_OPTS: '-javaagent:/opt/jmx-exporter/jmx_prometheus_javaagent-0.17.2.jar=9101:/opt/jmx-exporter/kafka-broker.yml'
Execution
Two docker-compose files are provided that spin up the Kafka cluster, Zookeeper, and Conduktor. docker-compose-conduktor-single.yml starts a cluster with one broker node. docker-compose-conduktor-mulitple.yml starts a cluster with three broker nodes. In this example the latest version of the Conduktor Platform at the time of writing, 1.4.0, is being used.
Start the stack with either:
docker-compose -f docker-compose-conduktor-single.yml up -d
Or
docker-compose -f docker-compose-conduktor-multiple.yml up -d
Once all the containers are running (which can be observed by listing with docker ps), start the Spring Boot application:
java -jar target/kafka-metrics-demo-1.0.0.jar
When the application has started, the REST request to trigger sending events can be sent via curl. To trigger sending a specified number of events:
curl -v -d '{"numberOfEvents":100000, "payloadSizeBytes":200}' -H "Content-Type: application/json" -X POST http://localhost:9001/v1/demo/trigger
To trigger sending events for a specified period of time:
curl -v -d '{"periodToSendSeconds":300, "payloadSizeBytes":200}' -H "Content-Type: application/json" -X POST http://localhost:9001/v1/demo/trigger
The request should respond immediately with a 202 ACCEPTED, as the application accepts the request and sends the events asynchronously. The application logs output to the console can be observed to see as the events are being emitted and consumed.
14:56:00.620 INFO  d.k.s.DemoService - Total events sent: 50000
14:56:00.621 INFO  d.k.c.KafkaDemoConsumer - Total events received (each 10000): 50000
Monitoring In Conduktor
With data flowing through the system, the metrics can now be observed in Conduktor. Navigate to the UI at:
http://localhost:8080
Log in with the default credentials:
admin@conduktor.io / admin
Select the 'Monitoring' screen from the drop down list in the top left. The Kafka cluster should be shown as 'My Local Kafka Cluster', in a healthy state.

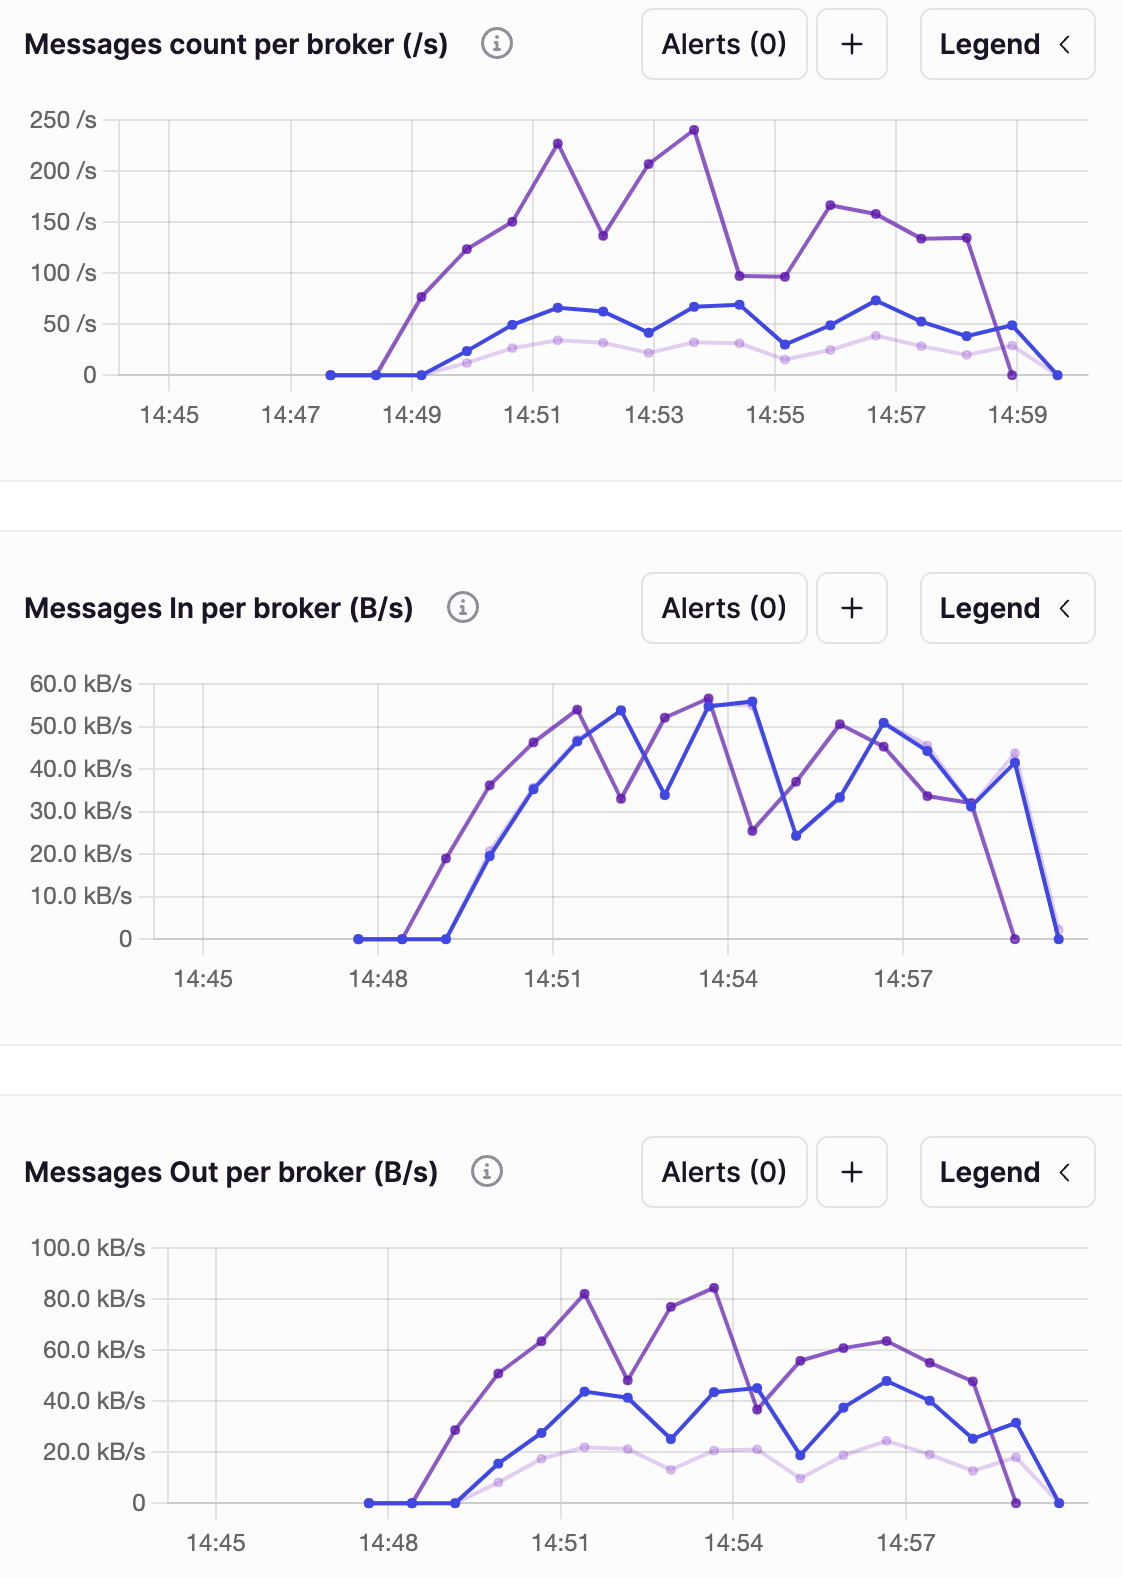
Select this to start examining metrics on the 'Cluster health' screen. Metrics for all brokers can be viewed together giving an obvious indication if one node has outlier behaviour. Alternatively the metrics can be observed for any individual node in the cluster.
Message counts, and bytes per second in and out of the broker can be observed. In this case there are three broker nodes in the Kafka cluster, so the comparison between the metrics from each can be seen.

The 'Partitions Health' screen shows the important partition health metrics. These are the offline, under replicated, and under min ISR replicas counts:

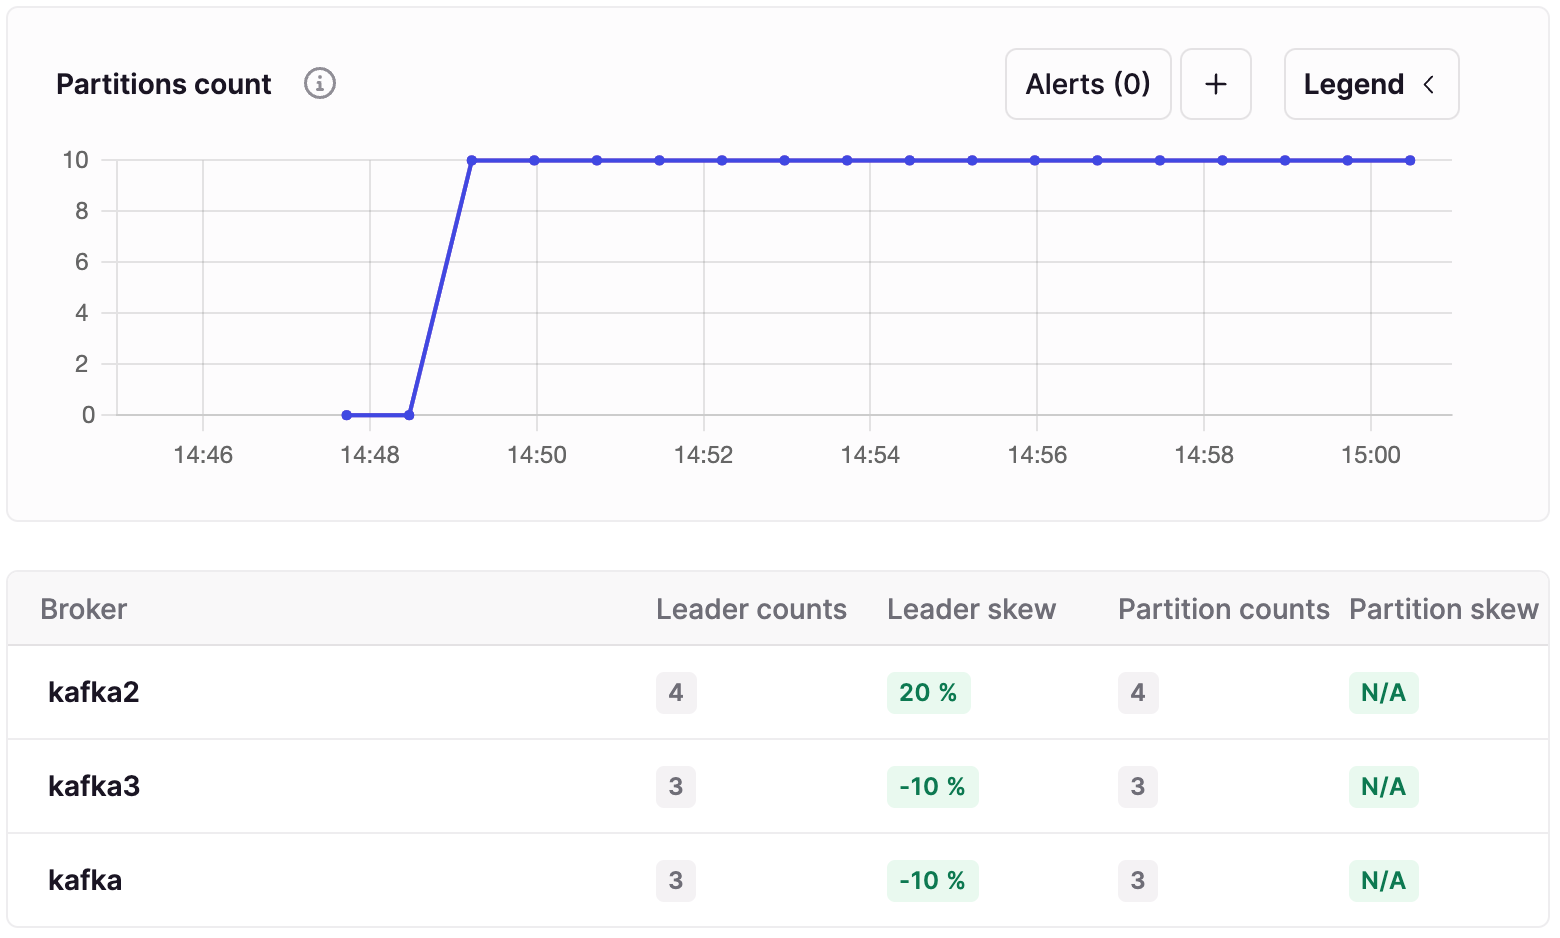
The 'Partitions distribution' screen shows how lead partitions are distributed across the brokers:

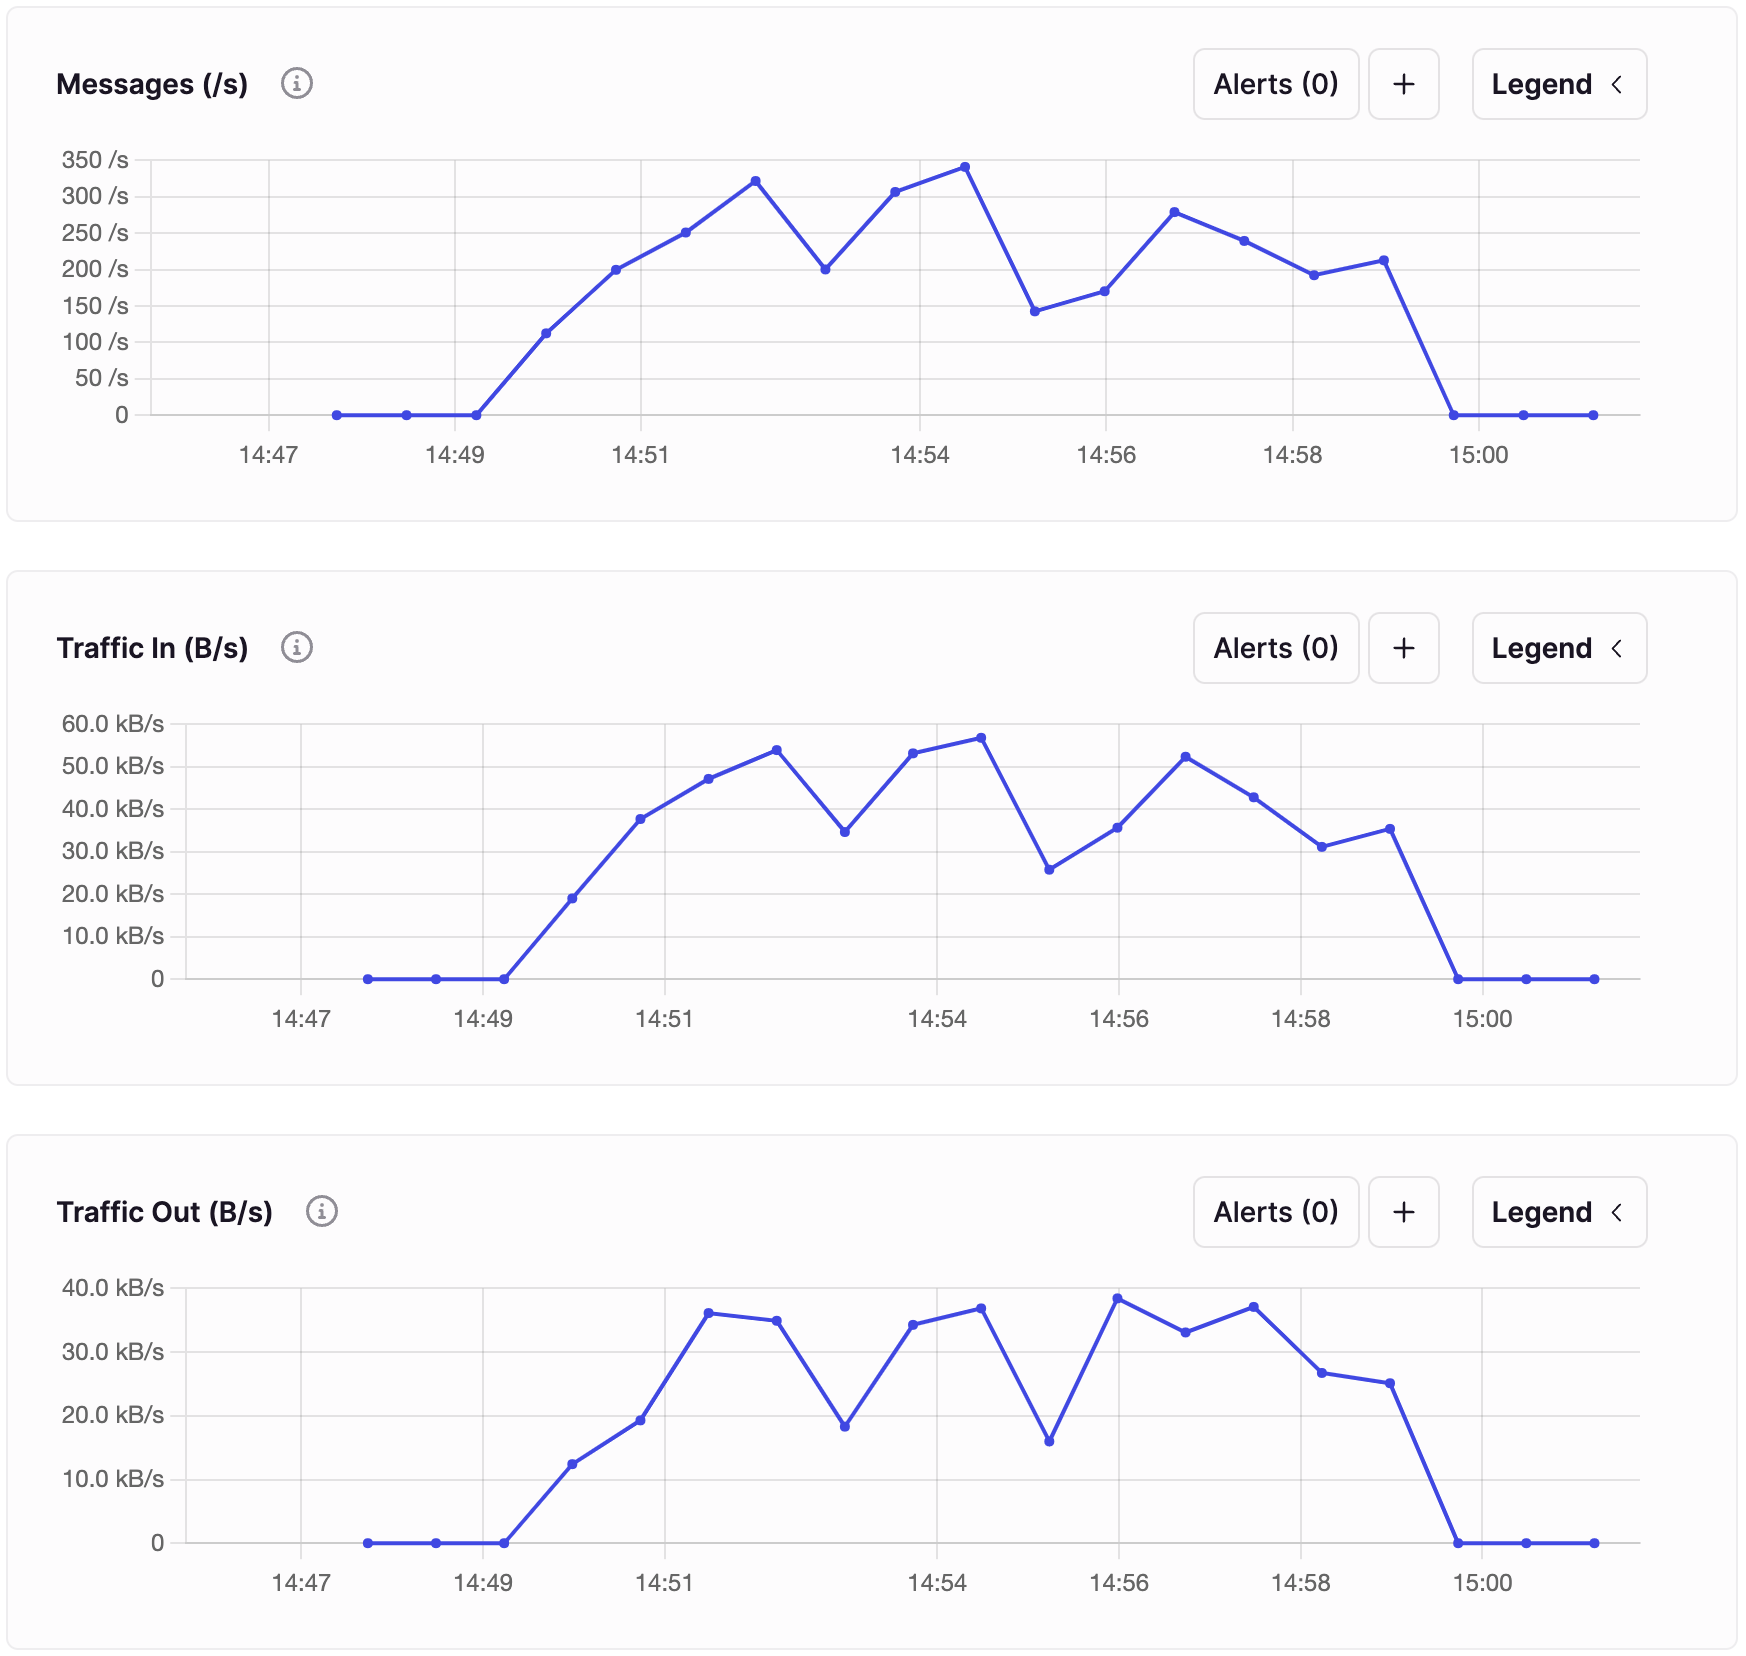
Selecting the 'Topic Monitoring' screen displays metrics on the topics. Again all topics can be viewed together or individually. In this case the demo-topic, the topic the application is writing to and consuming from, is selected. The messages and bytes per second being written and consumed can be observed.

And the 'Storage' tab shows the total size of the messages:

Alerts can also be set up in the UI when configured thresholds are exceeded, be it on broker nodes or topics.
There are many more metrics to explore. It is also possible to set up the Prometheus Node Exporter to export more metrics from the system including disk and broker capacity metrics, which will also be viewable in Conduktor. Check the conduktor.io docs for the latest options as the Platform evolves.
Application Analysis & Tuning
This demo application provides a utility to stress test a system under load over time. The application and broker/topic configurations can then be tuned, and the impact of these changes observed across test runs. For example, the impact of running a single broker node can be compared to running a cluster of multiple nodes that are configured to replicate data across nodes. In the docker-compose-conduktor-mulitple.yml configuration there are three broker nodes. The default topic replication factor is set to 3, and a minimum in-sync replicas count of 3. When an application producer has its acksconfigured as all (as configured in the application.yml), each event written to the broker must be replicated to all three brokers and acknowledged by each before considered successful, which will have an impact on throughput.
Conclusion
Monitoring a broker cluster is essential in order to ensure that it is behaving as expected and able to cope with the load being thrown at it. Conduktor Monitoring is one of many tools and services that are integrated into the Conduktor Platform. It provides a window into the key metrics exported by the broker using JMX. The ability to configure alerts on these metrics enables fast feedback when the system is under strain.
Source Code
The source code for the accompanying Spring Boot demo application is available here:
https://github.com/lydtechconsulting/kafka-metrics/tree/v1.0.0
More On Kafka: Monitoring & Metrics
Kafka Monitoring & Metrics: With Confluent Control Center: monitoring the Kafka broker, topic, consumer and producer metrics using Confluent Control Center.
[cta-kafka-course]


