Introduction
Component testing an application is an important layer of testing that validates the correctness of an application and its ability to integrate with external resources and third party services. When using an event driven architecture with Kafka as the messaging broker then having a window into the broker and the test events can aid with the development of these tests. The Conduktor Platform is a web application that provides this window amongst its product offerings.
This article demonstrates component testing a Spring Boot application that consumes and produces events from Kafka. The application also integrates with the Confluent Schema Registry in order to manage and apply event schemas. The article then steps through using Conduktor to provide insight into the data in the Kafka broker and Schema Registry, highlighting how it can play a useful role in developing and debugging these tests.
The source code for the Spring Boot application is
here.
Conduktor Platform
Conduktor have recently released their new Platform offering that brings together a number of products and utilities under one web application umbrella. One of these products is the Conduktor Console. It provides a user interface for inspecting the state and configurations of the Kafka broker and topics. Messages on the topics can be viewed, and if the Confluent Schema Registry is enabled the message schemas can be viewed and registered. This can provide useful information when writing and debugging component tests, such as being able to see whether events have made it to the topics as expected, and whether event schemas have been registered. The Console also integrates with Kafka Connect providing a view on connectors' configuration and data.
Component Test Framework
Lydtech's Component Test Framework provides the framework for running component tests that spin up the application under test and its external dependencies in Docker containers. The component tests, written as JUnit tests, are then able to test this running system, treating it as a black box. A JUnit extension annotation @TestContainersSetupExtension is added to each test class, which instructs the framework to bring up the system to test. It uses the Testcontainers testing library to start and manage the required Docker containers. The Component Test Framework also provides many utility classes to assist with different aspects of testing, such as for sending REST requests to the application under test, or writing and consuming events from Kafka. The latest release, 1.9.0, now also supports spinning up the Conduktor Platform. View the
ReadMe for the details on the framework.
Component Test And Conduktor Demo
Component Test Overview
The demo Spring Boot application simulates a payments service that receives send-payment command events, processes them, and emits resulting payment-sent events. The component test initialisation brings up two instances of this service, a Kafka broker, the Confluent Schema Registry, and the Conduktor Platform, each in their own Docker container.
The steps to build the application and run the component tests are detailed in the demo application Readme, and will be covered in detail in an upcoming article. The demo application's component-test module pom.xml should first be updated to enable Conduktor, by changing conduktor.enabled to true in the maven-surefire-plugin so that this is spun up in a Docker container. This will start version 1.0.2 of the Conduktor Platform Docker container, the latest at the time of writing. This can be changed by editing the conduktor.image.tag parameter.
The PaymentEndToEndComponentTest testFlow() test sends multiple messages to the application's inbound topic, and asserts on the resulting outbound events. The test parameters can be updated to make it a long running test which enables viewing the events flowing through the system in the Conduktor Console while the test runs. For example, update the totalMessages to 10000 and add a short delay between each send by updating delayMs to 15 milliseconds.
Component Diagram
The following diagram shows the components that comprise the system under test, with Conduktor providing a window on the state of the system during and after the test.

Once the Component Test Framework has orchestrated spinning up the Docker containers, the component test performs the following actions:

The Avro event schemas are registered with the Schema Registry.

10,000 send-payment command events are written to the demo application inbound send-payment topic.

The resulting outbound payment-sent events are consumed and asserted by the test listener.
The full component test flow will be detailed in the upcoming article.
Test Execution
The tests are run with:
mvn test -Pcomponent -Dcontainers.stayupThe Component Test Framework will leave the Docker containers running at the end of the test if they are started with the -Dcontainers.stayup flag. This enables further test development and running of component tests without the time cost of stopping and starting the containers between test runs. It also allows the data and state of the system to be inspected in Conduktor after a test run.
Conduktor Login
Once the containers are started the console output will show logging by the test of the events being sent to the inbound topic. At this point navigate to the Conduktor Platform login in the browser:
http://localhost:8088/admin/login
The port is defaulted to 8088, so this must be available on the local machine. Alternatively it can be overridden in the
pom.xml by configuring conduktor.port.
Log in to Conduktor with the following credentials:
Email: admin@conduktor.io
Password: admin
From the home screen launch the Console from the selection of products.
Conduktor Console Screens
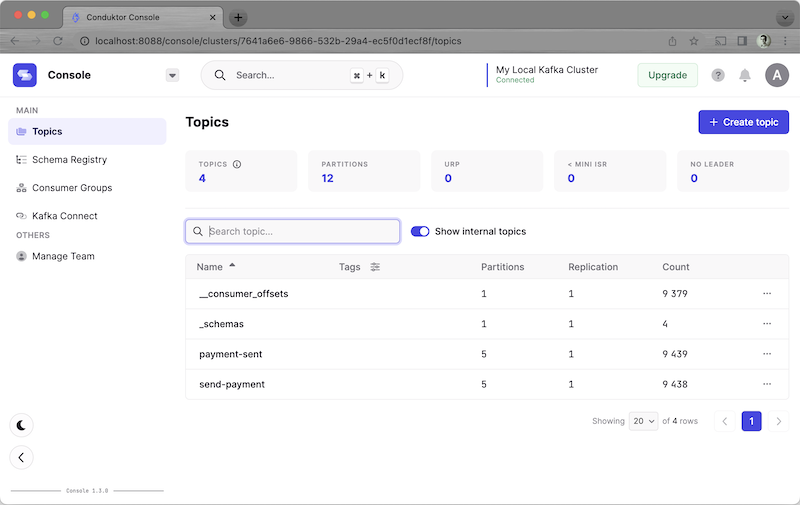
Once the Console is loaded the user is presented with the current list of topics in the broker. The key metadata from the topics is shown, with information such as the count of topics with less than the required minimum insync replicas, and the number of under replicated partitions.
Clicking on a topic drills into it, giving sizing information (that could be useful for sizing analysis), record counts, and the events themselves. It also has a time series graph showing the amount of data being written to the topic over time.
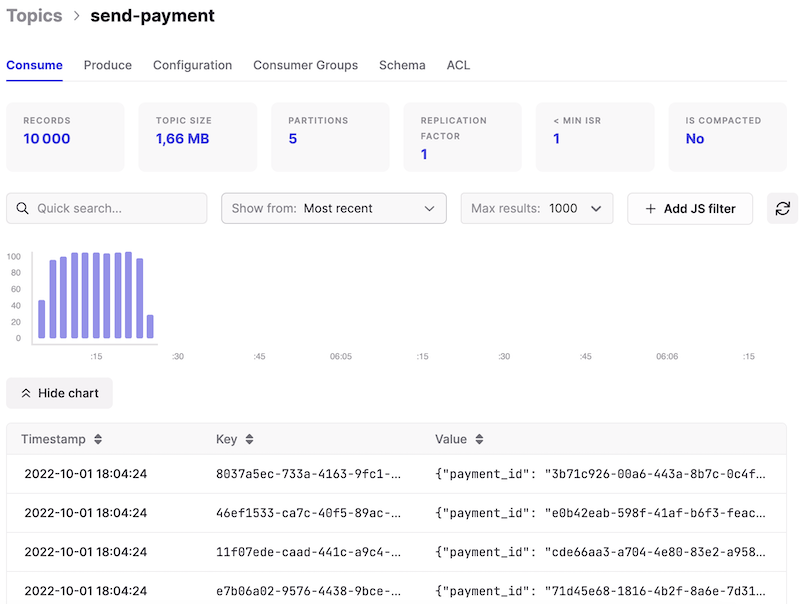
The events can be searched and filtered. This can aid diagnosing an issue with a component test, for example when trying to determine if an expected event has been written to a particular topic.
Clicking on an event then provides the full information on it, from the data itself to headers and metadata. In this example the event is serialized in the Avro format so is not human readable. However as Conduktor is connected to the Schema Registry it has access to the schema and is able to deserialize it and display it in readable form.

The Component Test Framework automatically configures the connection between Conduktor and the Schema Registry when both resources are enabled.
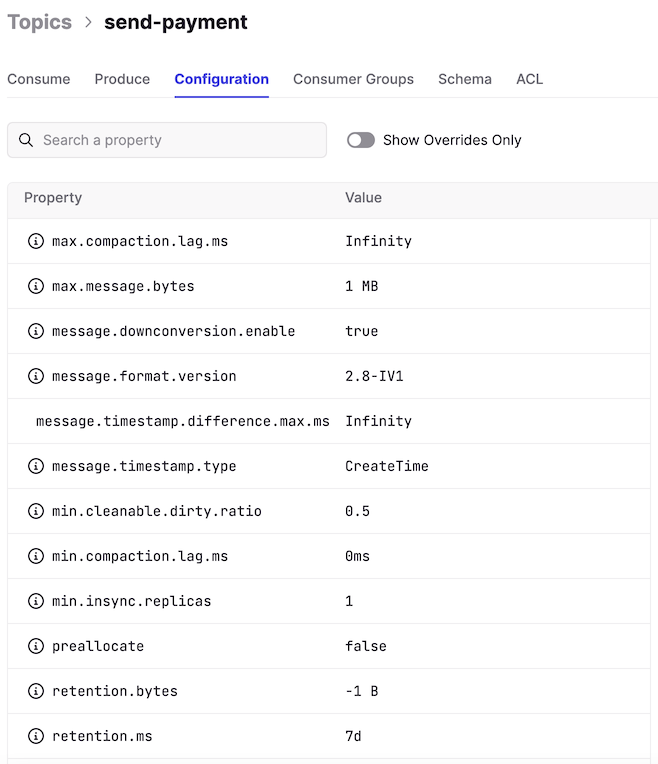
The topic details screen has multiple tabs including the option to send an event from the Console to the topic. In this screen the configuration tab is shown, which can be used to verify if the configuration that has been applied is as expected.
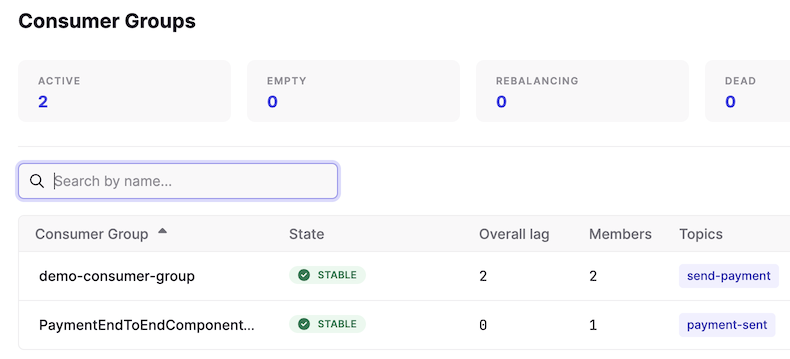
Selecting the consumer groups view from the left hand menu lists the consumer groups and their offset lag. In this case there are the expected two for the test. First is the consumer group called demo-consumer-group, which is the group created by the demo application for the inbound send-payment topic consumer. The second is the consumer group for the component test, PaymentEndToEndComponentTest-payment-sent. This is the group for the test consumer that listens to the outbound events from the demo application and asserts they are as expected.
Clicking on one of the groups opens up its details. In this case the demo-consumer-group is selected, and it can be seen that there are two consumers in this group. This is as expected, as there are two instances of the demo application running, each with their own consumer instance. The Component Test Framework was configured to create the topics with five partitions, and hence the partitions can be seen to be split across these two instances.
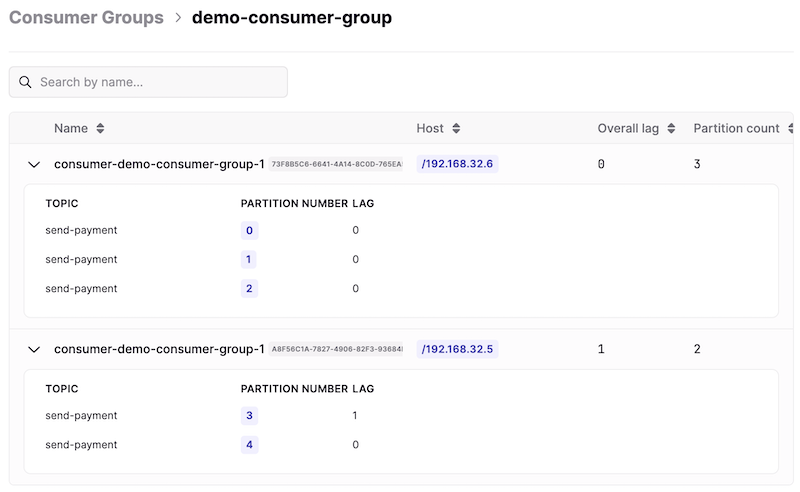
These views give the developer the chance to identify if the consumer groups are not present or configured as expected as they write their component tests. It also shows if any of the consumers have unexpected event lag which could be a clue if events are not being received in their test.
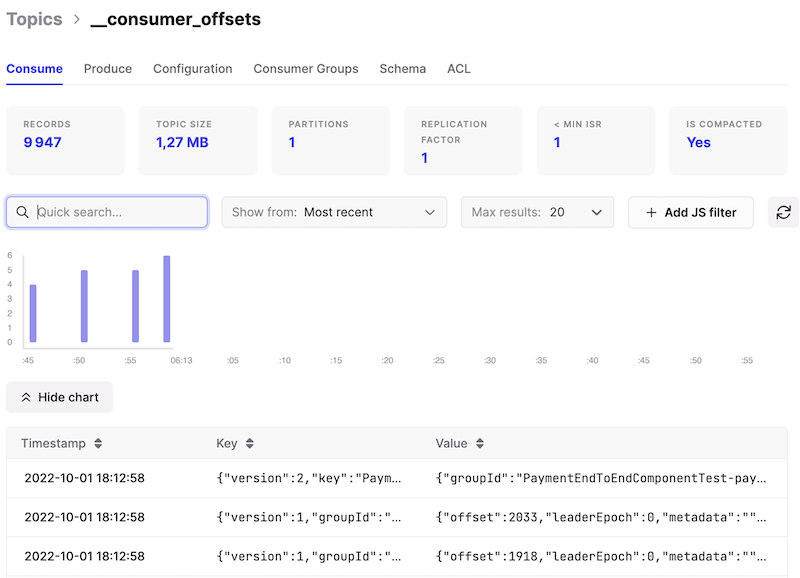
From the topics screen the internal topics can be viewed like any other topic. In this component test run there are internal topics for the consumer offsets and for the schema registry schemas. This screen shows the consumer offsets topic, a compacted topic that contains the latest committed offset for each topic partition by consumer group.
Selecting Schema Registry from the left hand menu brings up a view on the Confluent Schema Registry, with the current registered schemas listed.
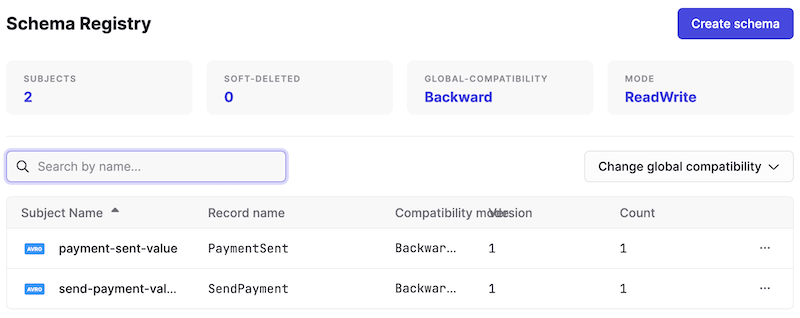
The component test itself registers the necessary schemas in the test start up. Clicking on a schema in this view then brings up the details, for example the schema for the send-payment event. This enables the developer to verify that the component test is registering the required schemas.

Conduktor - Beyond The Console
Using the Conduktor Console to aid in local component test development is one very specific use case for Conduktor. This scratches the surface of what is available on the Conduktor Platform. Beyond this there are many other products and utilities covering aspects such as monitoring, alerting, a canvas for creating test cases, topic as a service, and more. Being able to log in to a single web application and connect to any Kafka cluster in the network, whether local or in remote environments such as Dev or QA, removes barriers to exploring data, metrics, and more, whenever necessary. Visit Conduktor for their latest news and developments.
Conclusion
The integration of the Conduktor Platform with the Component Test Framework provides the developer with the tools necessary to diagnose issues as they develop their suite of component tests. The ability to leave the containers running following a test run means the developer can use Conduktor either during or after a test run to understand the data and state of the system.
Source Code
The source code for the accompanying Spring Boot demo application is available here:
https://github.com/lydtechconsulting/kafka-schema-registry-avro/tree/v1.0.0
The Component Test Framework source code is available here:
https://github.com/lydtechconsulting/component-test-framework/tree/v1.9.0
The library is available on Maven central. Add the following dependency:
<dependency>
    <groupId>dev.lydtech</groupId>
    <artifactId>component-test-framework</artifactId>
    <version>1.9.0</version>
</dependency>
[cta-kafka-course]