Kafka Monitoring & Metrics: With Confluent Control Center
Rob Golder - February 2023
Rob Golder - February 2023
This is the second of a two part series on monitoring a Kafka cluster. This part looks at using the Confluent Control Center for monitoring, and its integration into Lydtech’s Component Test Framework that is able to automate load tests. The companion Spring Boot application’s component test is then used to demonstrate exporting of metrics that are surfaced in Control Center.
The first part of this article, Kafka Monitoring & Metrics: With Conduktor, focused on using Conduktor Platform to monitor the Spring Boot application.
The source code for the Spring Boot demo application is available here.
In part one of this series the need for monitoring a Kafka cluster is covered. Metrics from the broker and application Kafka consumers and producers are exported via JMX which can then be surfaced in the monitoring tool.
The Confluent Control Center is a web based tool for monitoring the health of the cluster and observing the metrics exported from the broker, as well as metrics gathered from the application consumers and producers. For more on the Control Center, view the documentation.
Lydtech’s open source Component Test Framework enables component tests to be written that then automatically bring up the system under test in Docker containers. The required components are simply defined in configuration, and the framework orchestrates and manages the container lifecycles using Testcontainers. The developer does not need to be concerned with starting, stopping and connecting to the containers as this is all abstracted away. For the purpose of this demonstration the framework will spin up the Spring Boot demo application, the Kafka cluster, Zookeeper, and the Confluent Control Center.
The Spring Boot demo application is the same one used in the first article in the series. A REST endpoint is defined that accepts a request to trigger emitting events to Kafka. This can either be a set number of events, or a set period of time during which events are produced. The application then consumes these events from the topic, enabling metrics to be captured for the round trip.
A component test is used to send in this REST request. The application accepts the request, sending the events via an asynchronous hand-off, and returns a 202 ACCEPTED. The component test uses the Component Test Framework to orchestrate spinning up the required Docker containers. These house the Kafka cluster nodes, Zookeeper, Confluent Control Center, and multiple instances of the Spring Boot application.

Figure 1: Component diagram
The one service instance of the demo application that receives the REST request from the component test writes to each of the lead partition replicas for the five partitions in the demo-topic. These are typically spread across the broker nodes to ensure load is spread evenly. The topic is configured with a replication factor of 3. These writes are therefore replicated from each of the lead partition replicas to each of their two follower partition replicas in the other two broker nodes. The three service instances’ consumers each then consume the events from one of the replicas for each of the five partitions.
 The component test sends a REST request to one of the service instances to trigger sending events.
 The service produces the requested number of events to each of the five lead partition replicas for the topic. The data is replicated to the follower partition replicas across the broker nodes.
 The service consumes the events from a replica partition for each partition of the five partitions.
 Control Center gathers the exported metrics from the broker nodes, topics, and service Kafka consumers and producers.
 The user of the system monitors the metrics in the Control Center web application.
The configuration for the component tests is defined in the maven-surefire-plugin in the pom.xml, in a profile called component. This is the plugin that executes the component tests when executed using maven. The required resources are enabled, with three Kafka broker nodes in the cluster and the Confluent Control Center.
<service.instance.count>3</service.instance.count>
<kafka.enabled>true</kafka.enabled>
<kafka.broker.count>3</kafka.broker.count>
<kafka.topic.partition.count>5</kafka.topic.partition.count>
<kafka.topic.replication.factor>3</kafka.topic.replication.factor>
<kafka.min.insync.replicas>3</kafka.min.insync.replicas>
<kafka.control.center.enabled>true</kafka.control.center.enabled>
<kafka.control.center.export.metrics.enabled>true</kafka.control.center.export.metrics.enabled>
Three instances of the service under test are also configured, ensuring there are three consumers in the consumer group. The broker and topic configuration is also defined, in this case with 5 partitions per topic, a default topic replication factor of 3, and a minimum in-sync replicas of 3. This means that each event written to a topic partition must be replicated to each of three nodes, and each node must acknowledge the write before it is considered successful.
By also enabling metrics export to Control Center, further metrics from the broker, and from the Kafka producer and consumer are exported. For the producer and consumer metrics an interceptor must be added, which enables monitoring of throughput and lag. The interceptors are defined in the KafkaDemoConfiguration class. For the consumer the following is included:
config.put(ConsumerConfig.INTERCEPTOR_CLASSES_CONFIG, "io.confluent.monitoring.clients.interceptor.MonitoringConsumerInterceptor");Likewise for the producer:
config.put(ProducerConfig.INTERCEPTOR_CLASSES_CONFIG, "io.confluent.monitoring.clients.interceptor.MonitoringProducerInterceptor");Note their inclusion results in a Confluent internal topic being created, so if these metrics are not required it can be disabled be configuring kafka.confluent.monitoring.intercept.enabled in the application-component-test.yml.
The containers are configured to stay up automatically between test runs via the property containers.stayup. This means the Control Center Docker container is still running after the test run, enabling inspection of the metrics generated during the test run.
<containers.stayup>true</containers.stayup>As well as configuring the broker and topics between test runs, the application can be configured and tuned. The application-component-test.yml has a number of settings such as for consumer polling (maxPollIntervalMs, maxPollRecords), and producer settings (lingerMs, acks, async). The impact of changing these can then be observed in Control Center.
The component test is defined in EndToEndCT. A REST request is sent to the application stipulating either the number of events to send, or the period to send the events.
@Test
public void testFlow() {

    Integer NUMBER_OF_EVENTS = 100000;
    Integer PERIOD_TO_SEND_SECONDS = 600;
    Integer PAYLOAD_SIZE_BYTES = 200;

    TriggerEventsRequest request = TriggerEventsRequest.builder()
//          .numberOfEvents(NUMBER_OF_EVENTS)
        .periodToSendSeconds(PERIOD_TO_SEND_SECONDS)
        .payloadSizeBytes(PAYLOAD_SIZE_BYTES)
        .build();

    RestAssured.given()
        .spec(ServiceClient.getInstance().getRequestSpecification())
        .contentType("application/json")
        .body(JsonMapper.writeToJson(request))
        .post("/v1/demo/trigger")
        .then()
        .statusCode(202);
}
The test class is annotated with @ExtendWith(TestContainersSetupExtension.class). This is all that is required to hook into the Component Test Framework during test setup, in order for it to spin up the required Docker containers.
From the project root directory the Spring Boot application jar file is built with maven, and then the Docker container is built:
mvn clean install

docker build -t ct/kafka-metrics-demo:latest .
The test is then executed using the component maven profile to ensure only the component test is run.
mvn test -PcomponentAs containers are being left up following the test run so that the metrics can be observed, they can be removed afterwards using:
docker rm -f $(docker ps -aq)Once the test is underway the resulting metrics can be observed in Control Center. Navigate to:
http://localhost:9021The home screen shows the status of the cluster, in this case showing there are three broker nodes:
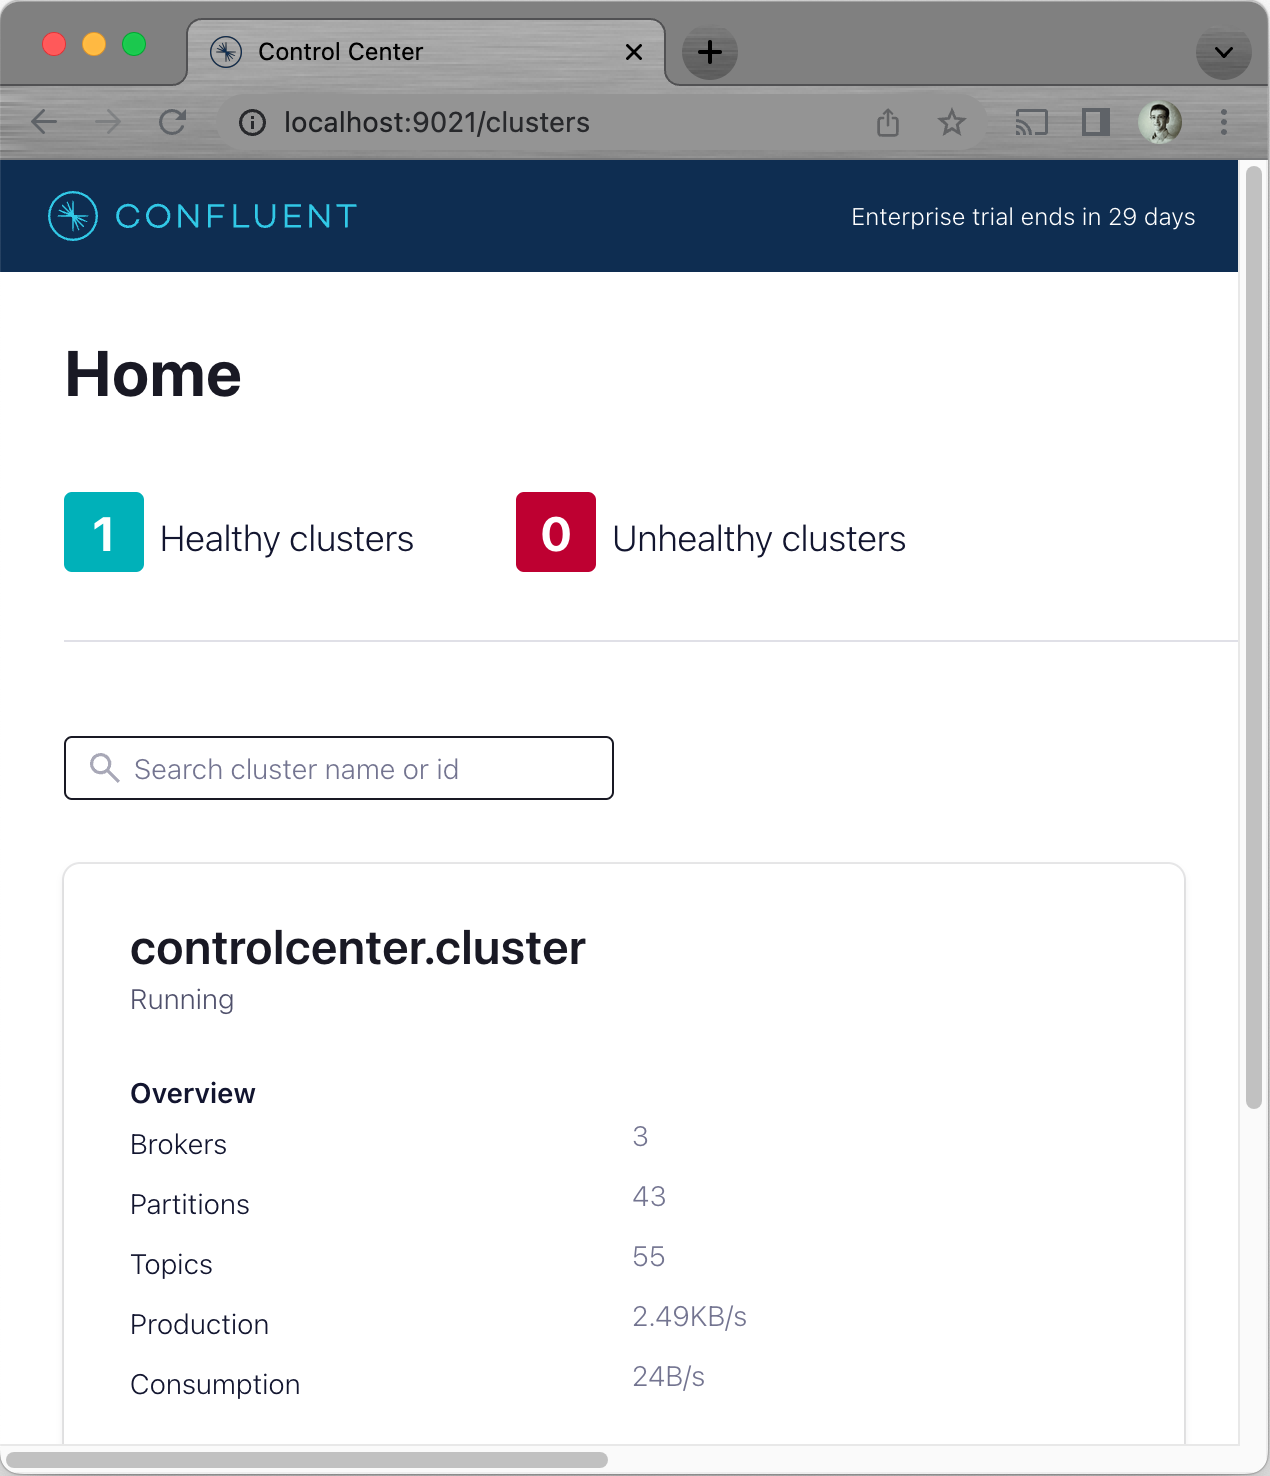
Figure 2: Clusters overview
Select the cluster to view its main metrics, including important metrics concerning under replicated partitions and out-of-sync replicas:
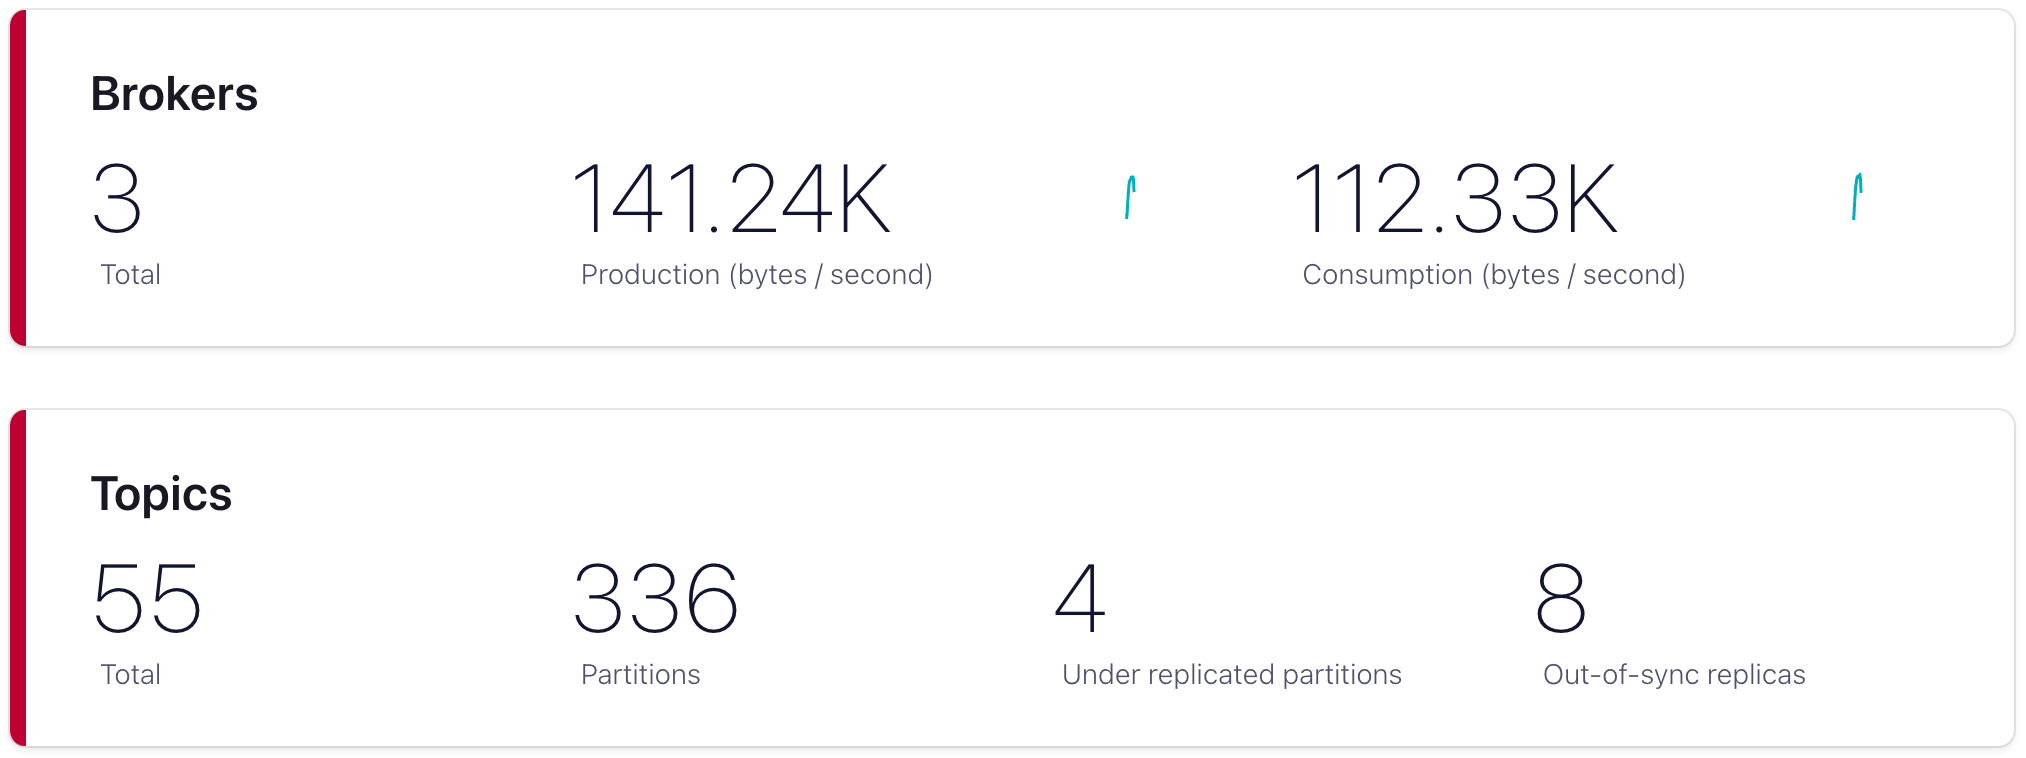
Figure 3: Cluster metrics
Replication, under replicated partitions and in-sync replicas are covered in detail in the article Kafka: Replication & Min-Insyc Replicas.
While the demo application has one topic, the total topics shows as 55. This is because Control Center creates many internal topics for tracking metrics over time.
Navigating to the Topics menu on the left, the demo-topic can be selected to view its metrics:
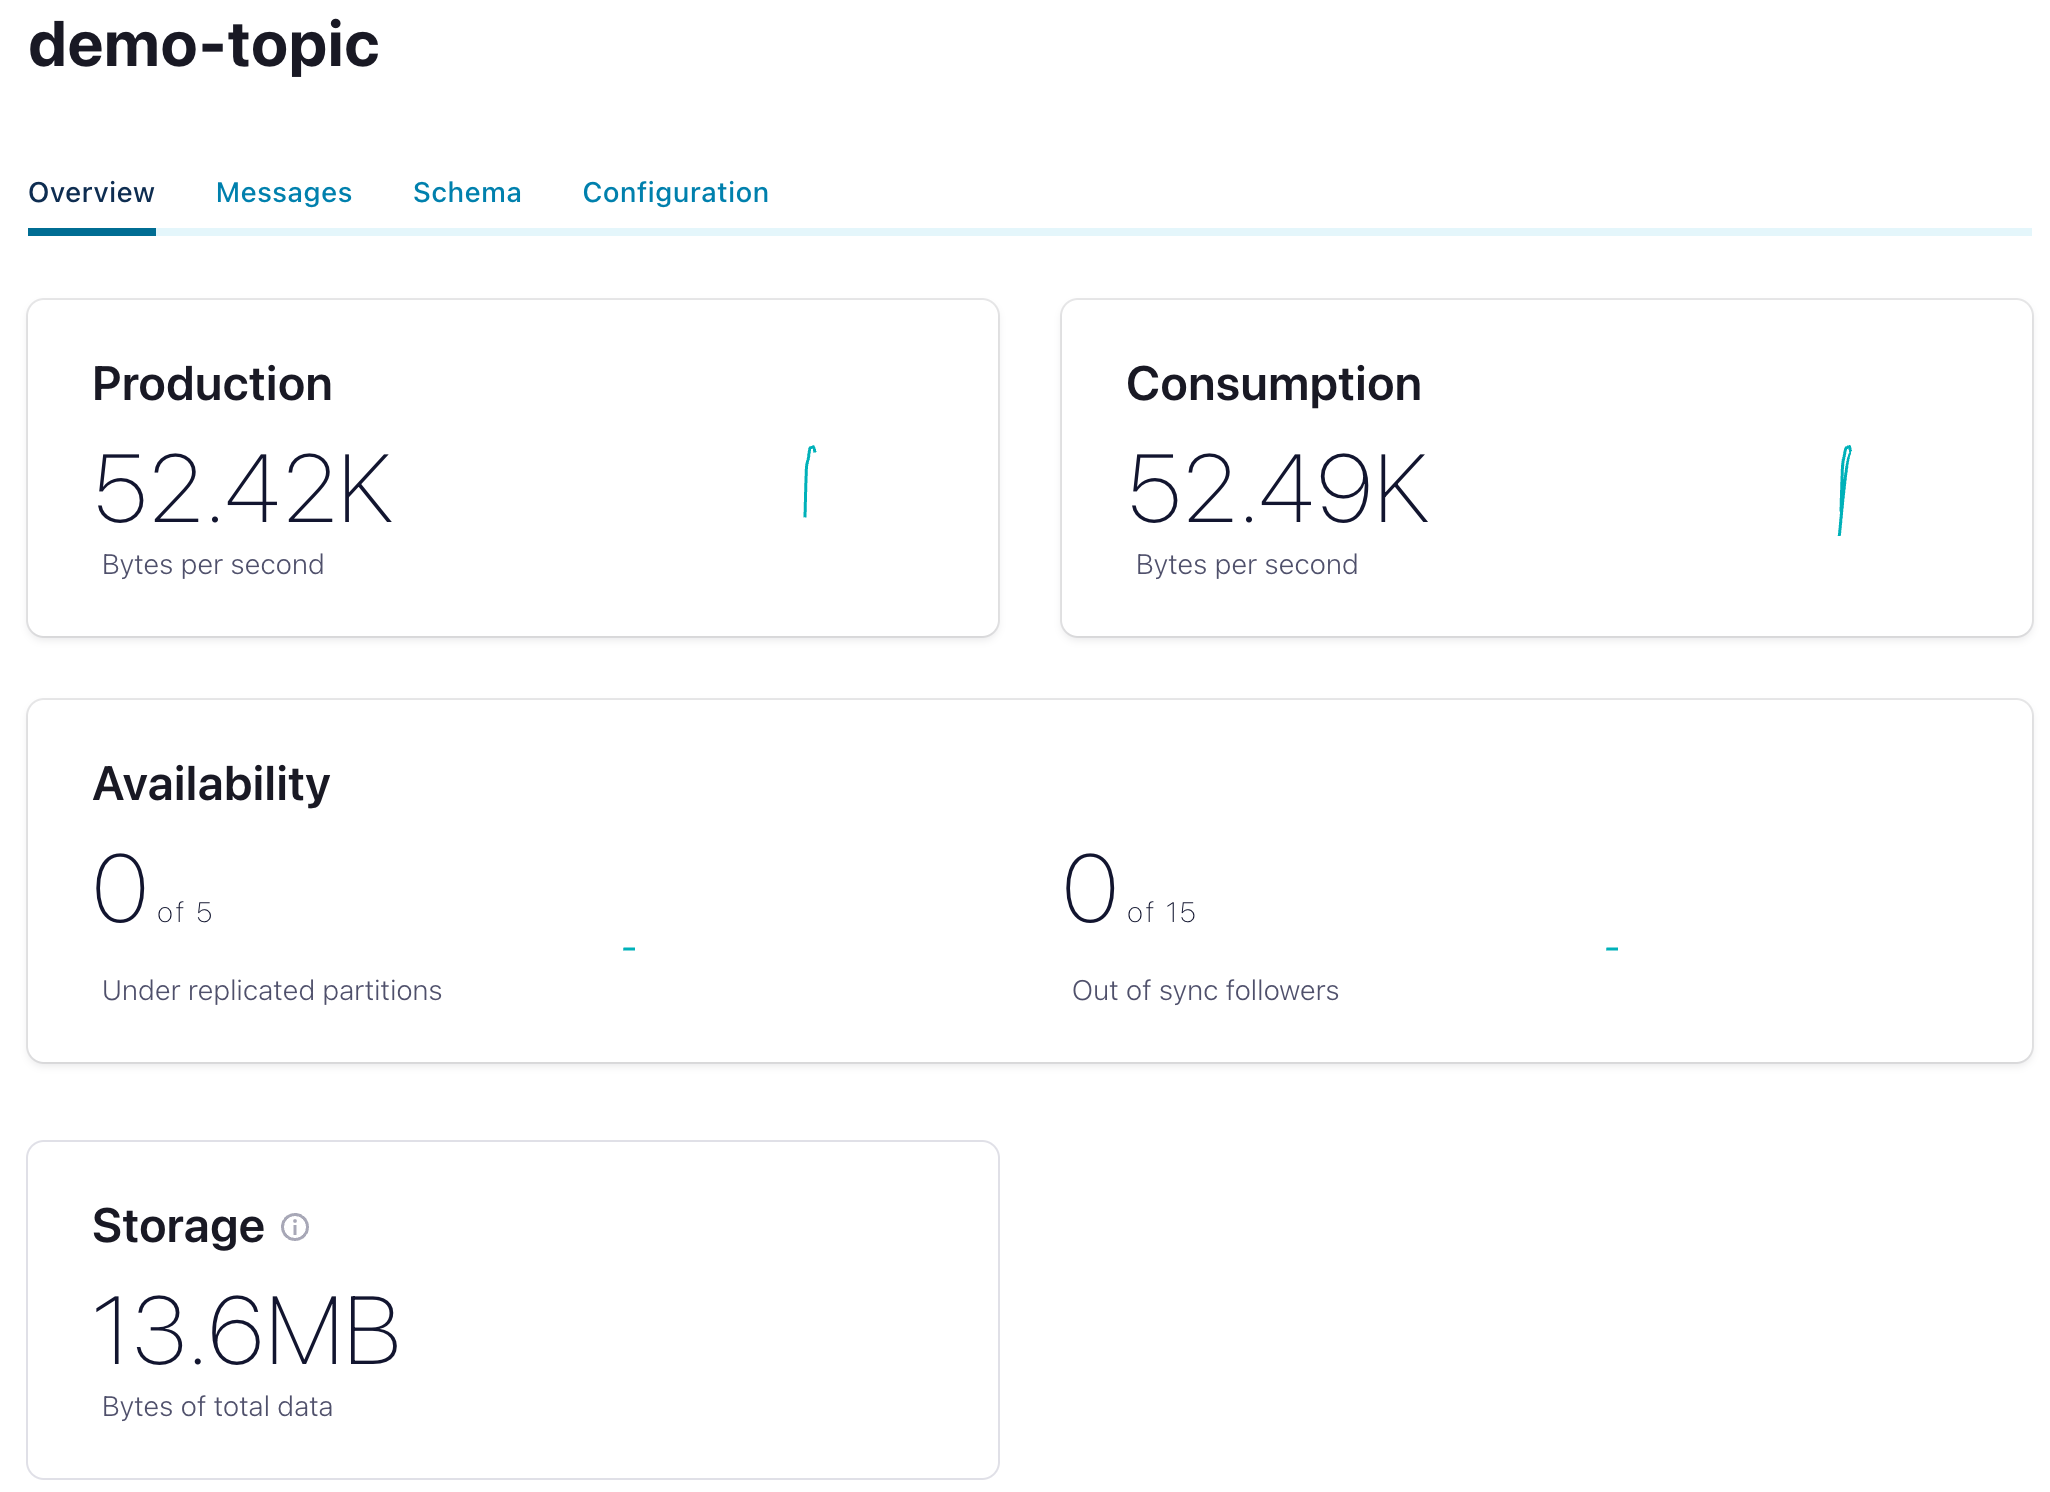
Figure 4: Topic metrics
The messages that are being written to the topic can also be viewed:
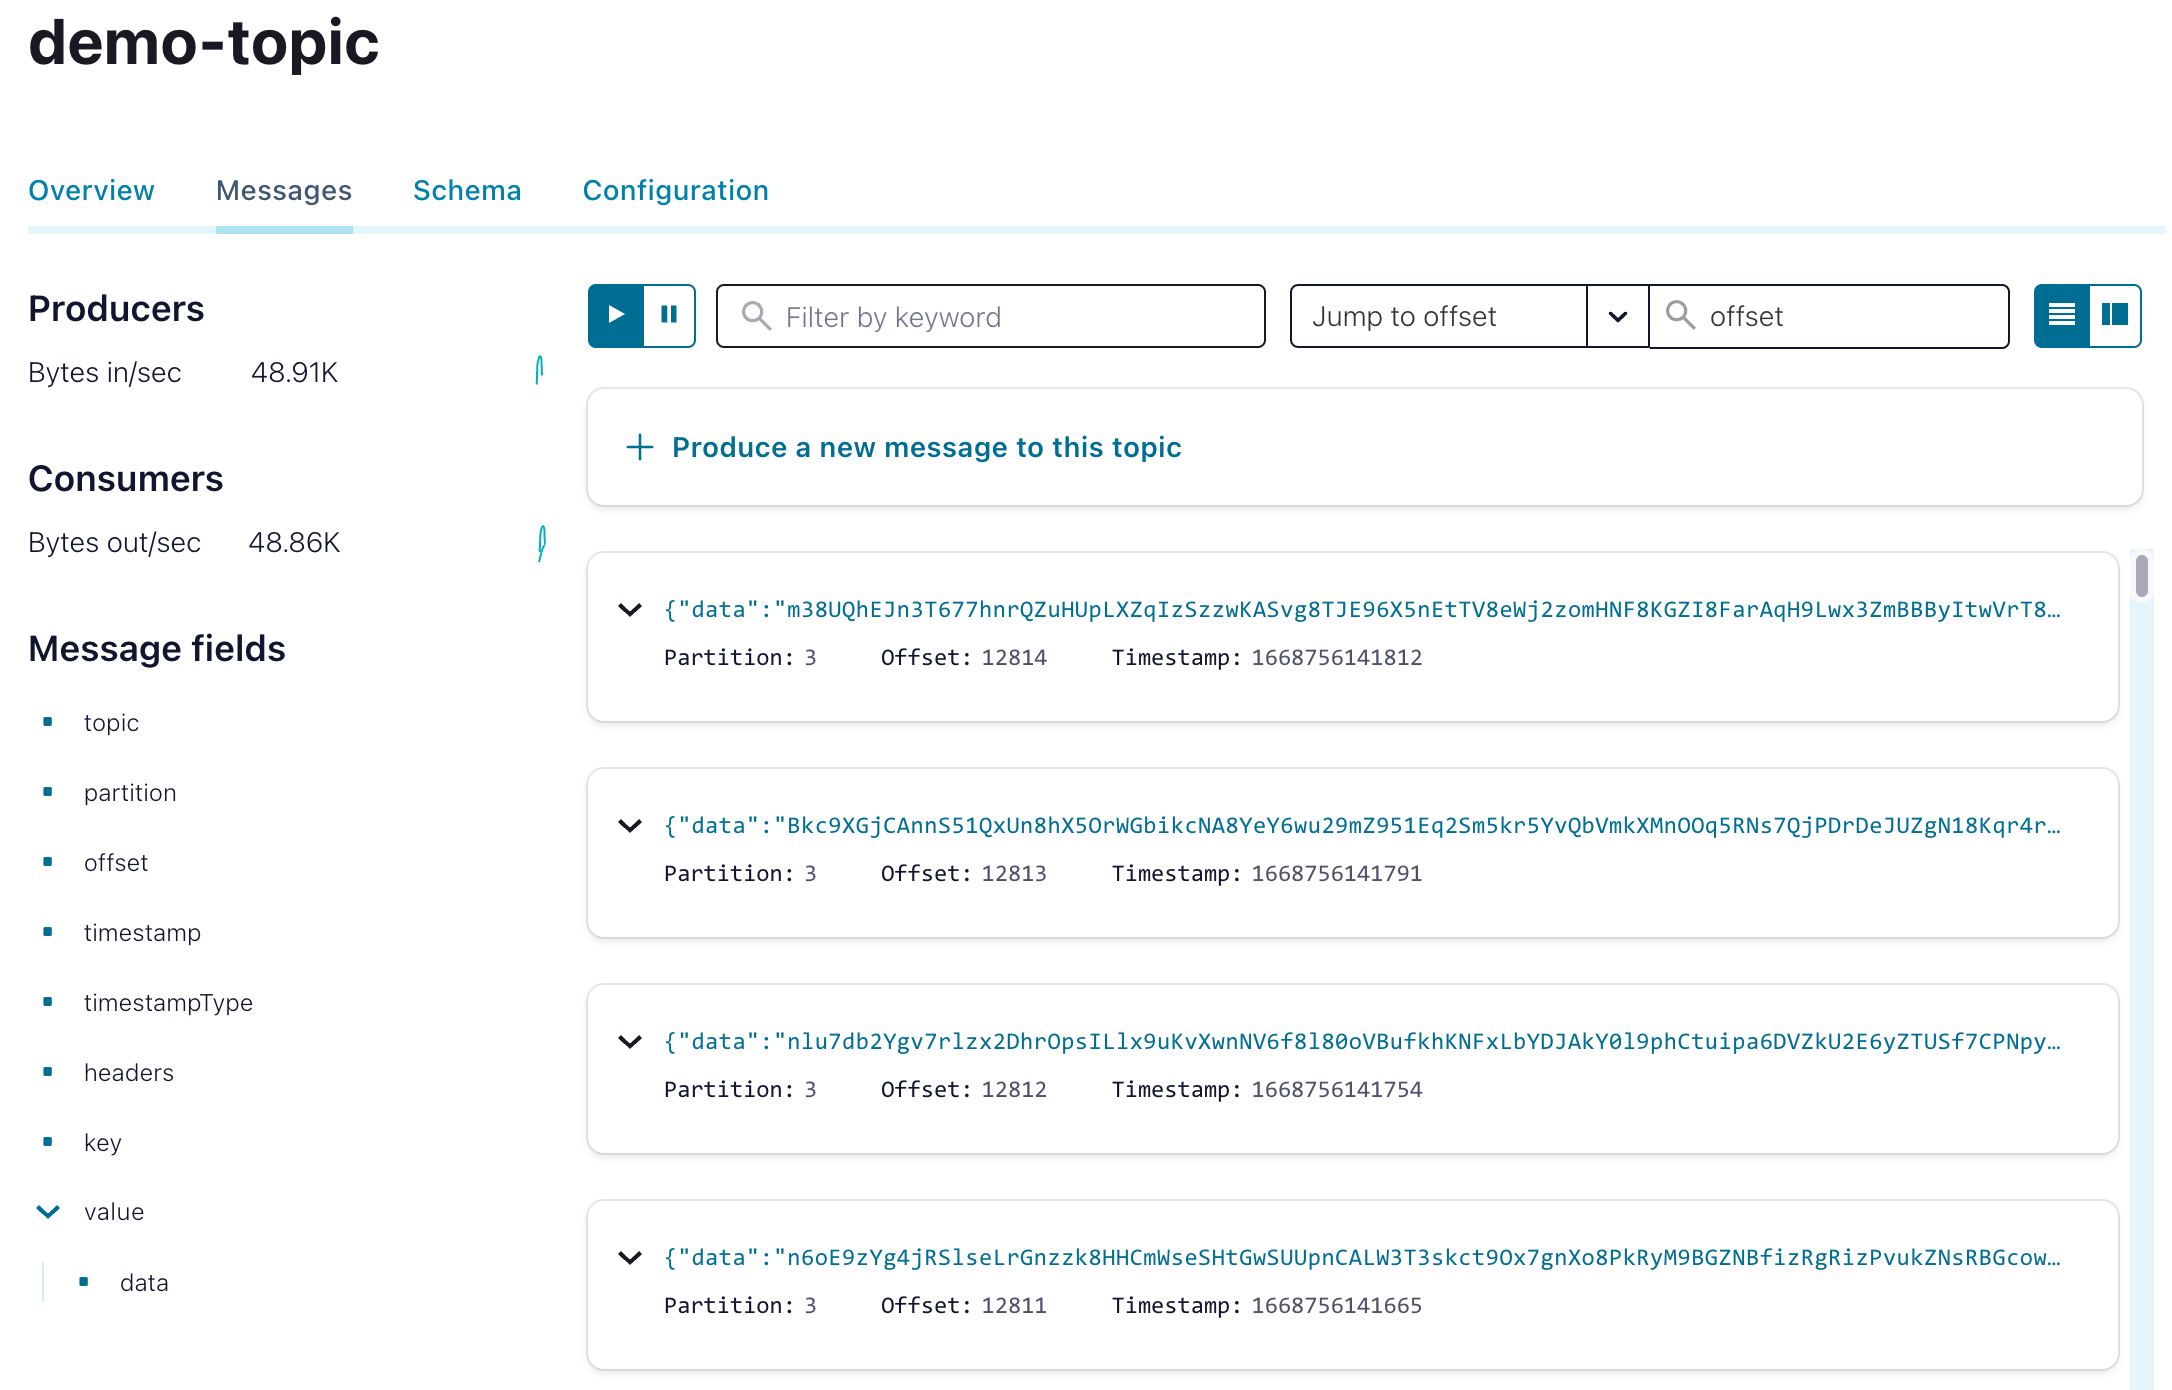
Figure 5: Topic messages
Selecting the Consumers menu displays the consumer groups. Select the demo-consumer-group, that is the demo application consumer group, and the clients are listed for each of the five topic partitions. The current and end offsets, as well as lag can be viewed. In this case two of the partitions are a message behind the end offset:
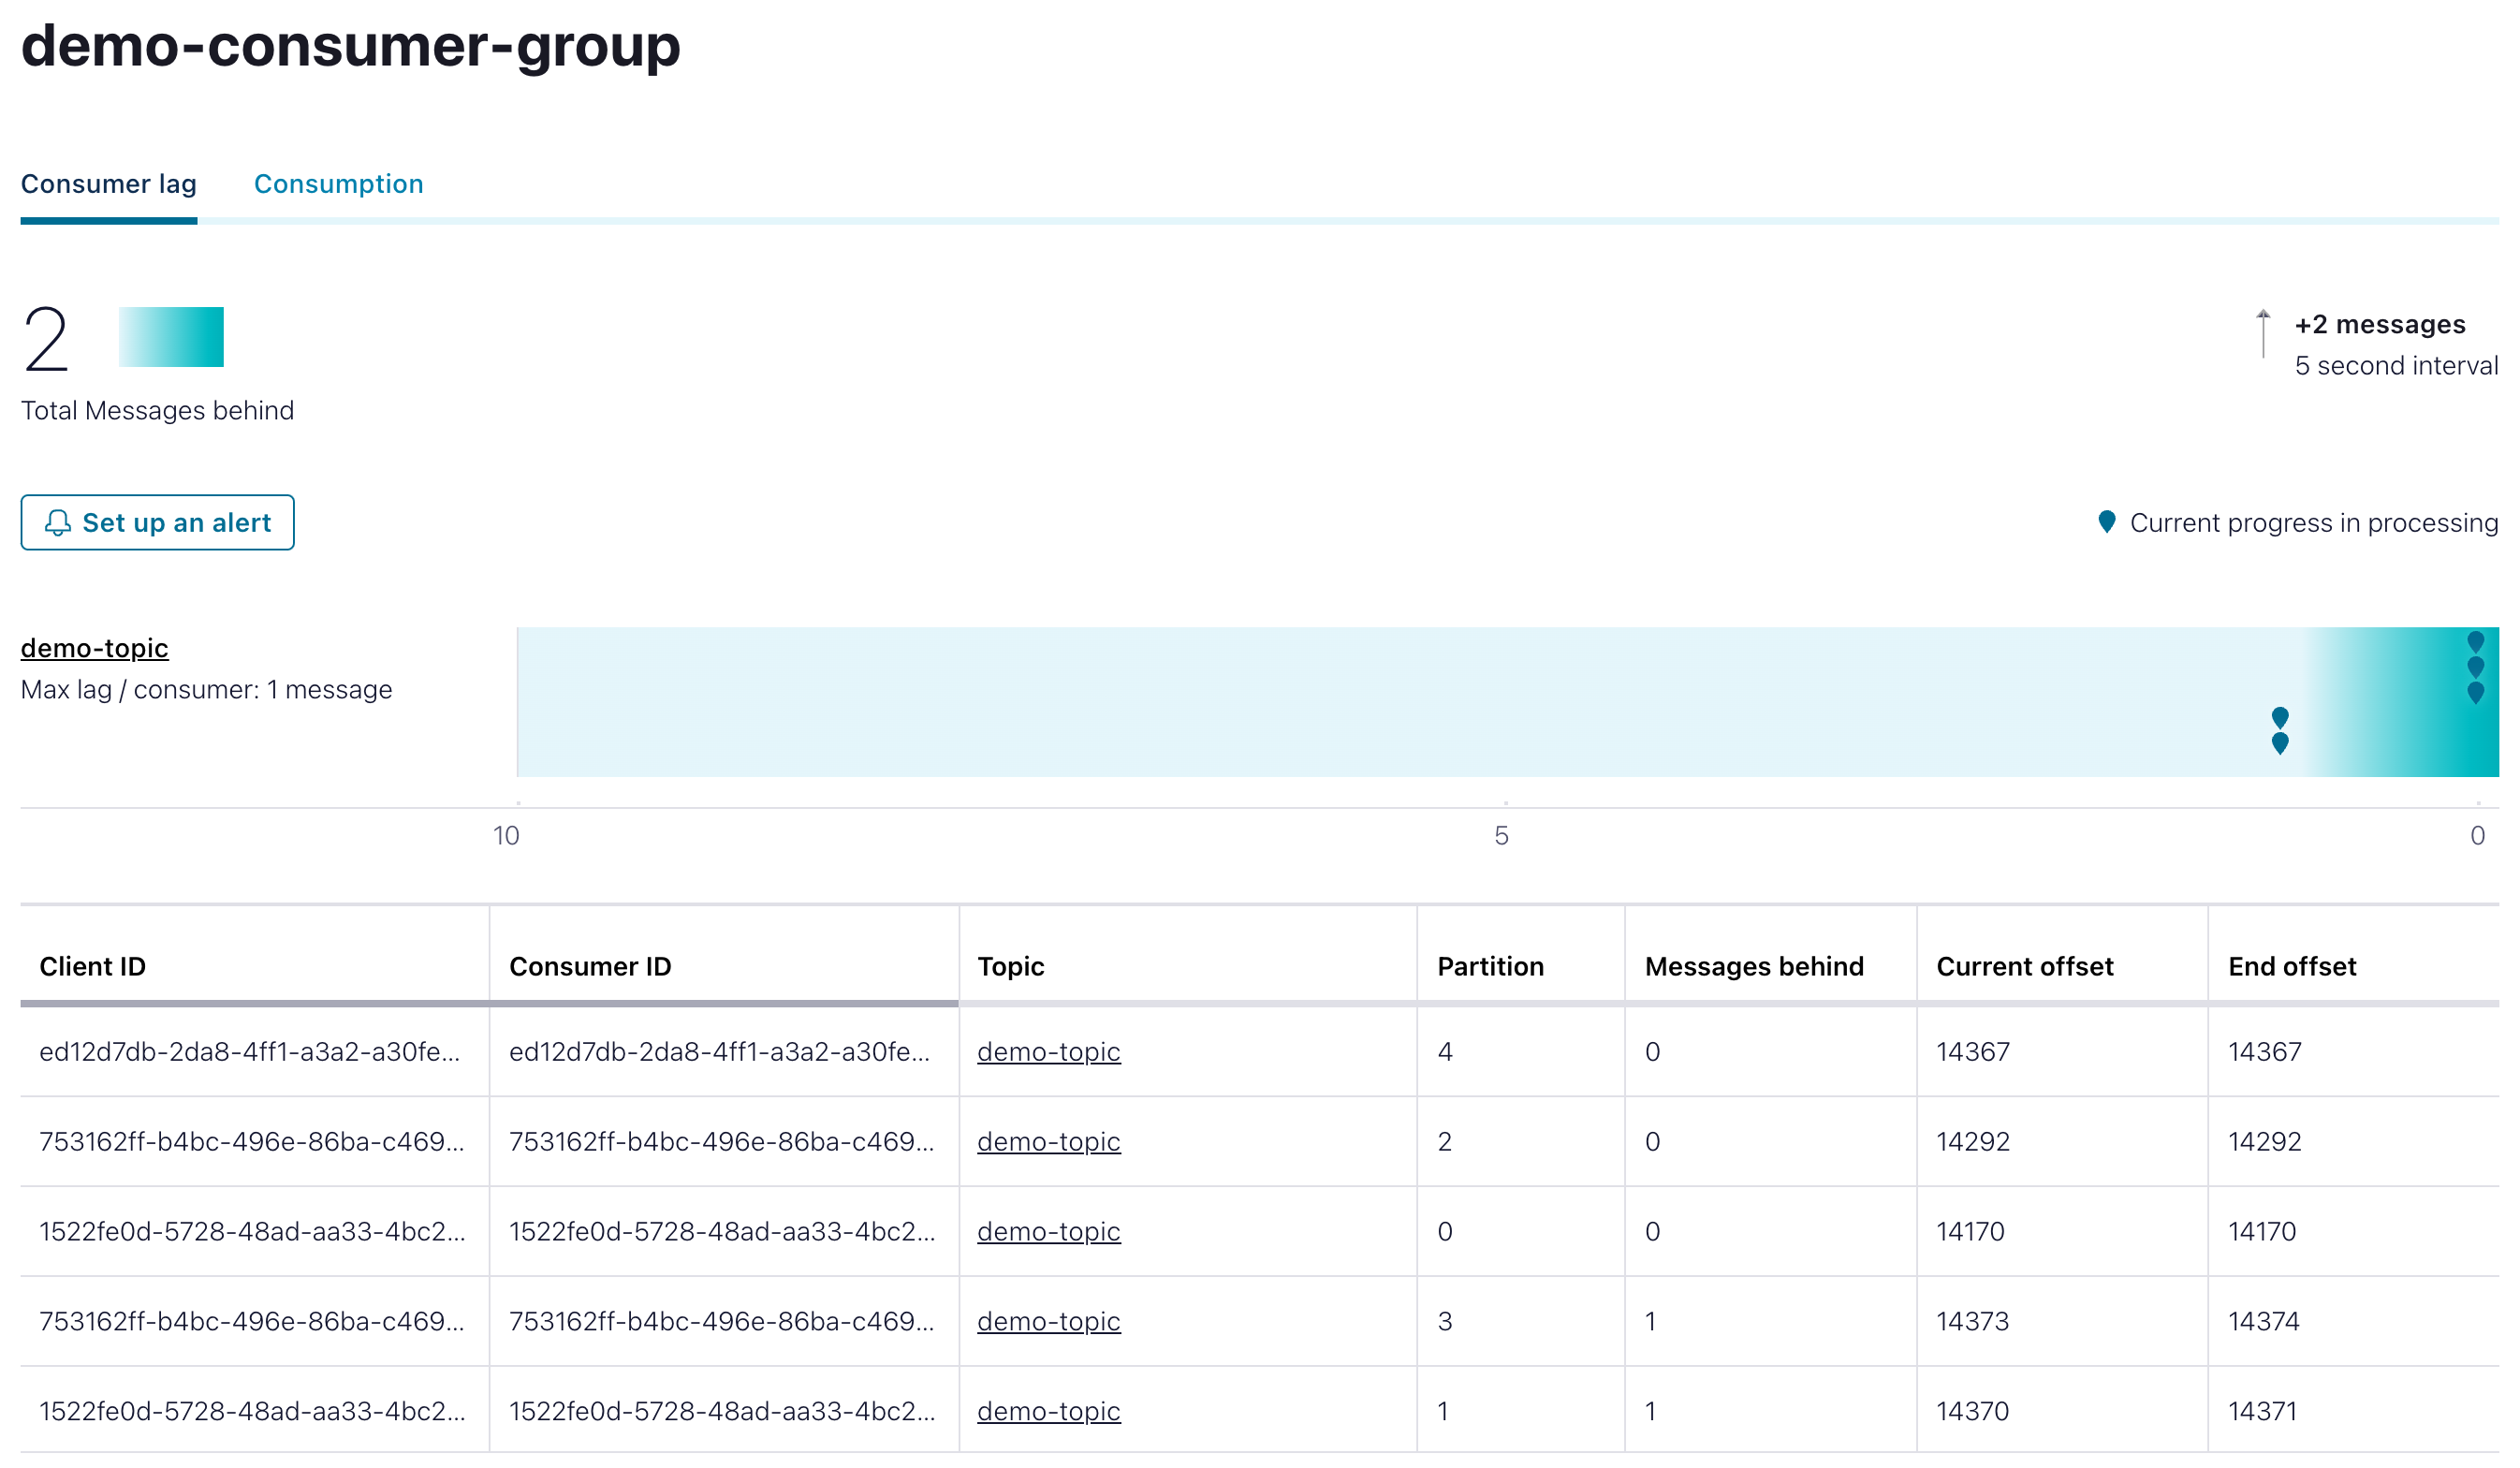
Figure 6: Consumer group data and metrics
Alerts can be set up to provide a visual indication if a particular metric threshold is exceeded, or not been met.
In this same view the Consumption tab displays the number of messages consumed, and the important end-to-end latency. This is calculated from the metrics intercepted from the application Kafka producer and consumer.
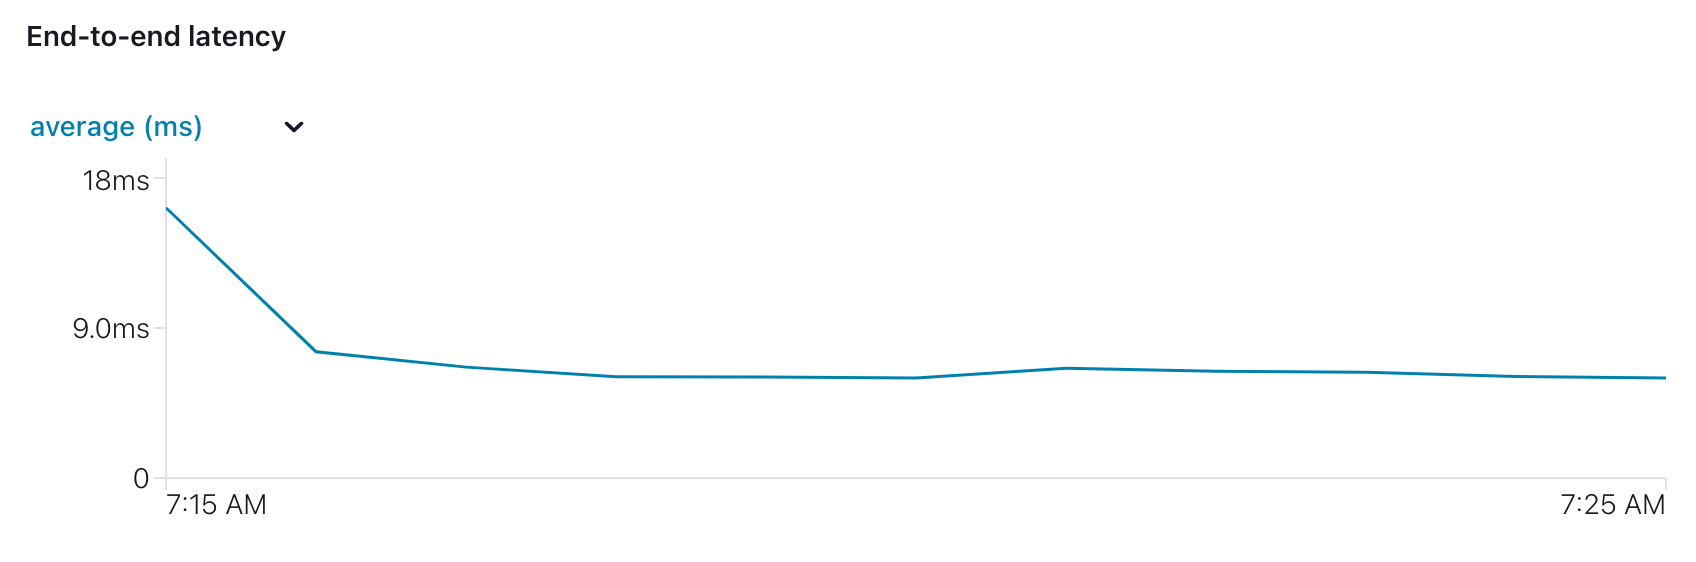
Figure 7: End-to-end latency
The component test provides the opportunity to put the application under load and see how it performs. The broker, topics and application can be configured and tuned, and the impact assessed in Control Center between test runs. For example, the number of application instances can be increased or decreased, as can the number of broker nodes. The data replication requirements can be tuned, trading off durability and latency.
Confluent Control Center provides a view over the key metrics for a Kafka deployment. By integrating with the Component Test Framework it is straightforward to monitor an application under load and observe how it is impacted by different configurations. By driving the load via automated tests the deployment can be monitored in different environments with the tests executing in the pipeline.
The source code for the accompanying Spring Boot demo application is available here:
https://github.com/lydtechconsulting/kafka-metrics/tree/v1.0.0
Kafka Monitoring & Metrics: With Conduktor: monitoring the Kafka topic and broker metrics using the Conduktor Platform.
View this article on our Medium Publication.

