Rob Golder - June 2024

The Prometheus Alertmanager component is the third tool in the monitoring and alerting setup that this article covers, alongside Prometheus and Grafana which are covered in the preceding two parts of this article. Alertmanager is responsible for managing and raising the alerts that are configured using rules in Prometheus. In this third and final part of the series the demo walkthrough continues. The rules that determine what alerts should fire are configured, along with the targets that Alertmanager should notify. The example alerts are triggered, observing notifications being sent to Slack.
This is the third of three parts in this series on monitoring and alerting:
The companion repository that contains all the configuration and resources to run the monitoring demo, along with the Spring Boot application itself, is available here.
As covered in the previous article, Prometheus is configured in the prometheus.yml properties file with the location of Alertmanager in order to send alerts that are raised, along with the rule definitions that define what alerts should be raised. For this demo two rules are configured in the rules.yml file.
The first rule raises an alert if an instance is down for longer than 10 seconds:
- name: Health_Alerts
 rules:
 - alert: InstanceDown
   expr: up == 0
   for: 10s
The second rule raises an alert if a Kafka consumer group is found to be lagging by more than 100 events for longer than 10 seconds. This suggests a consumer is struggling to cope under the load, and is unable to consume events fast enough.
- name: Kafka_Alerts
 rules:
 - alert: LaggingConsumerGroup
   expr: kafka_consumergroup_lag > 100
   for: 10s
Each rule is decorated with further information including labels and annotations which provide context and detail on the alert.
Alertmanager is also configured, via the alertmanager.yml properties file, as to where and how often alerts should be raised. A route section specifies how alerts are grouped, deduplicated, and the intervals before repeat notifications are sent, and importantly the receiver to use. The corresponding receiver section then details where the notifications are sent. Alertmanager supports many receiver targets, with frequently used ones being Slack, email and Pagerduty. In the demo example alerts are sent to a Slack channel called #demo-alerts:
receivers:
- name: 'slack-notifications'
 slack_configs:
 - channel: '#demo-alerts'
   api_url: 'SLACK_WEBHOOK_URL'
   send_resolved: true
   text: [NOTIFICATION TEXT]
The api_url must be replaced with the Slack webhook endpoint that must be configured for the Slack workspace in use. Instructions on configuring the webhook are available in the Slack documentation. The text section is replaced with the required notification text. This has the option of including metadata on the alert that Alertmanager includes in the data it sends. For example, to include the alert description then output { { .Annotations.description } }. The send_resolved flag is set to true, meaning that when the alert is resolved, a corresponding notification will be sent as well.
The rules.yml and alertmanager.yml properties files are mounted for use on the Prometheus and Alertmanager docker containers respectively, in the docker-compose.yml file.
With the containers running the alerts can now be triggered. To trigger the health check alert, the Postgres exporter container is stopped:
docker stop postgres-exporterAfter a short period the alert is raised, and can be viewed in Alertmanager. Alertmanager of course is running in a docker container, and its web interface is available at:
http://localhost:9093/
Figure 1: Alertmanager health alert
The alert notification is also sent to Slack:

Figure 2: Slack health alert notification
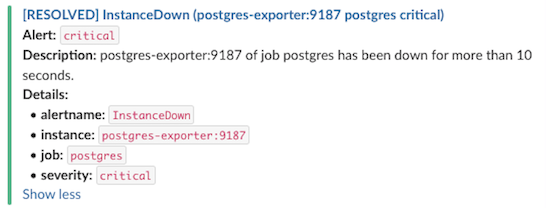
Once the alert has been raised the container can be restarted:
docker start postgres-exporterAfter a short period (based on the send_resolved configuration) a resolved notification will be sent to Slack :

Figure 3: Slack health alert resolved notification
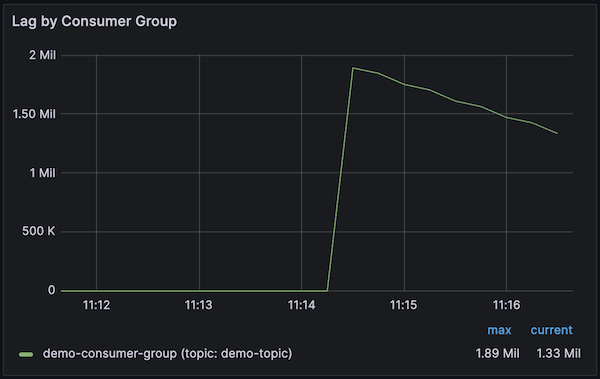
The second alert that has been configured is for when an application’s Kafka consumer group is found to be lagging, being over 100 messages behind the topic partition offset for over 10 seconds. To cause this situation to occur, the application endpoint can be called to trigger sending a large volume of events. By setting the delay between each send to 0 milliseconds, large batches of events are sent to the topic. The application consumer quickly falls behind as it consumes and processes each message serially. Trigger the events with:
curl -v -d '{"periodToSendSeconds":5, "delayMilliseconds":0}' -H "Content-Type: application/json" -X POST http://localhost:9001/v1/triggerViewing the consumer lag panel in the Kafka dashboard in Grafana, it can be observed that such a high volume of events are generated that the consumer lag nearly reaches 2 million and remains high for a sustained period:

Figure 4: Consumer lag visualised in Grafana
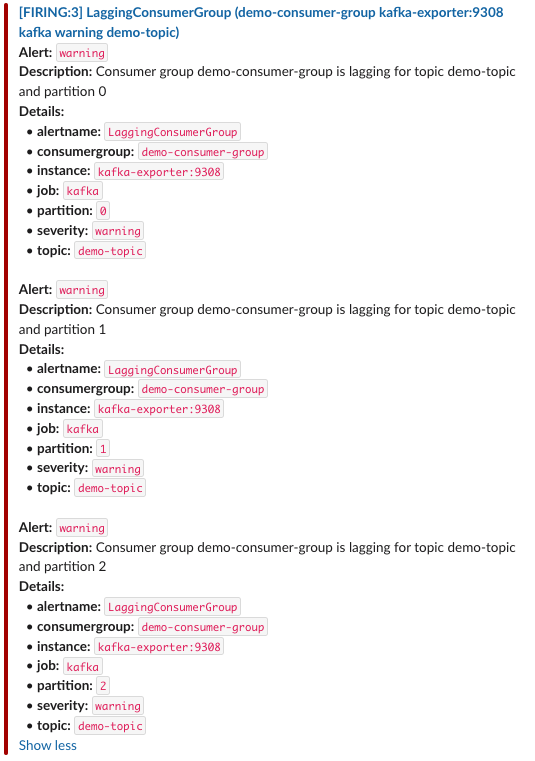
As a result the alert is triggered, one for each topic partition that is lagging for the application consumer group. This can be observed in Alertmanager:

Figure 5: Slack Kafka consumer group lag alert notifications
The three alert notifications are sent to Slack:

Figure 6: Slack Kafka consumer group lag alert notifications
As with the other resources, Prometheus is configured to scrape metrics from Alertmanager in the prometheus.yml properties file:
- job_name: alertmanager
 static_configs:
   - targets: ['alertmanager:9093']
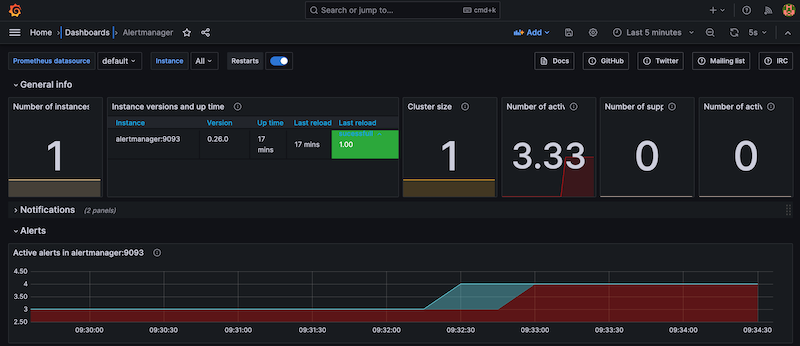
The Alertmanager dashboard is imported into Grafana as described in the previous article. Metrics around the health, CPU and memory usage of the service are surfaced, along with metrics on the alerts being raised. Here the dashboard shows that 4 alerts, the health check alert and 3 consumer lag alerts, have been triggered:

Figure 7: Monitoring Alertmanager
Prometheus, Grafana and Alertmanager provide the ability to comprehensively monitor a system and raise alerts when configured rule thresholds are breached. Metrics are scraped from configured targets by Prometheus, with Grafana querying the metrics to visualise in charts and graphs. Prometheus raises alerts using Alertmanager to notify different targets like Slack and Pagerduty, enabling the support team to act efficiently to resolve issues.
The source code for the accompanying monitoring demo application is available here: https://github.com/lydtechconsulting/monitoring-demo/tree/v1.0.0.
View this article on our Medium Publication.