Introduction
Monitoring and alerting are an essential part of any system deployment. It ensures that the system is running smoothly, and if not that alerts notify the necessary people to allow them to take remedial actions. There are many tools that can be employed to achieve this, one of the most popular set of tools being the open source Prometheus, Grafana, and Alertmanager. Each plays a separate role in providing the overall monitoring setup.
This three part series walks through setting up and using such a monitoring system using Prometheus, Grafana and Alertmanager. It demonstrates monitoring the deployment of a Spring Boot application and the database and messaging broker that it integrates with, namely Postgres and Kafka, all of which are running in Docker.
This is the first of three parts in this series on monitoring and alerting:
- Part 1: Monitoring And Alerting Introduction (this part)
- Monitoring and alerting with Prometheus, Grafana and Alertmanager
- Overview of the monitoring and alerting demo
- Overview of the Spring Boot demo application
- Overview on exporting metrics from Kafka and Postgres
- Part 2: Monitoring Demo
- Configuring Prometheus
- Walkthrough of the monitoring demo
- Observing metrics scraped by Prometheus
- Importing dashboards into Grafana
- Generating metrics using the Spring Boot application
- Observing the metrics in Grafana
- Part 3: Alerting Demo
- Configuring rules for alerting in Prometheus
- Configuring targets for alert notifications in Alertmanager
- Walkthrough of the alerting demo
- Triggering alerts and raising notifications
- Monitoring of Alertmanager
The companion repository that contains all the configuration and resources to run the monitoring demo, along with the Spring Boot application itself, is available here.
Monitoring Tools
Overview
Prometheus, Grafana, and Alertmanager combine to provide a popular, scalable and resilient best of breed open source solution for monitoring and alerting, to manage operational risk.

Prometheus
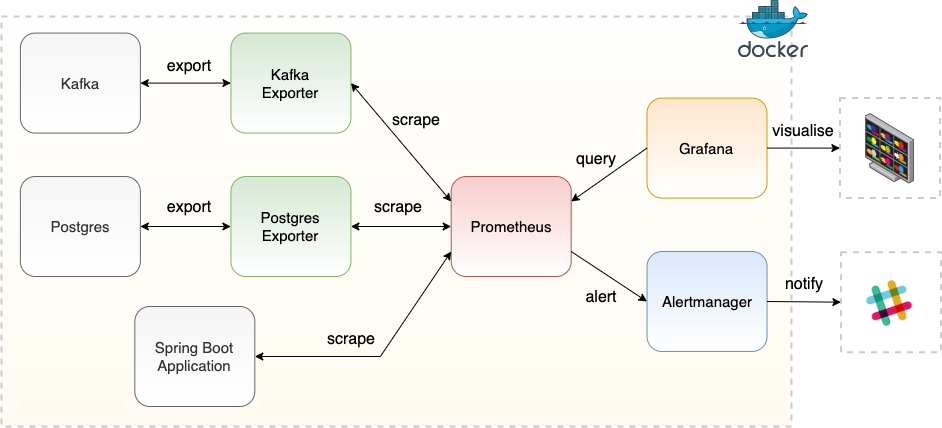
Prometheus is the central piece in the monitoring system. It collects and stores metrics from resources as time series data, making them available for other tools to act upon such as for visualising and alerting. Metrics are captured via a pull mechanism over HTTP, known as scraping, with monitoring targets determined by service discovery or static configuration.
Grafana
Grafana is a rich visualization platform that enables users to observe and query the state of the system stack via dashboards. The dashboards are configured with charts and graphs to view the metrics that Grafana queries from Prometheus.
Alertmanager
Prometheus raises alerts based on configured rules and sends these to Alertmanager, which is a Prometheus component. Alertmanager manages the alerts, and is responsible for notifying interested parties based on configuration, be it via email, Slack, Pagerduty or many other integrations.
Monitoring Demo Overview
The system comprises a Spring Boot application that integrates with Kafka as the messaging broker to send and receive events, and performs reads and writes to a Postgres database. Prometheus, Grafana and Alertmanager provide the monitoring hub. All these components are deployed in Docker containers.
Metrics are exported from the Spring Boot application using Spring Actuator and Micrometer. Spring Actuator is responsible for auto-configuring Micrometer, and exposes an endpoint for Prometheus to scrape the metrics. To acquire the Kafka and Postgres metrics an exporter for each is deployed. These export the available metrics, making them available to Prometheus.

Parts 2 and 3 in this series of articles step through configuring this setup, bringing up the components in Docker, configuring the application and the exporters to export metrics to Prometheus, configuring dashboards in Grafana, and sending alerts to Slack using Alertmanager based on configured rules.
Spring Boot Application
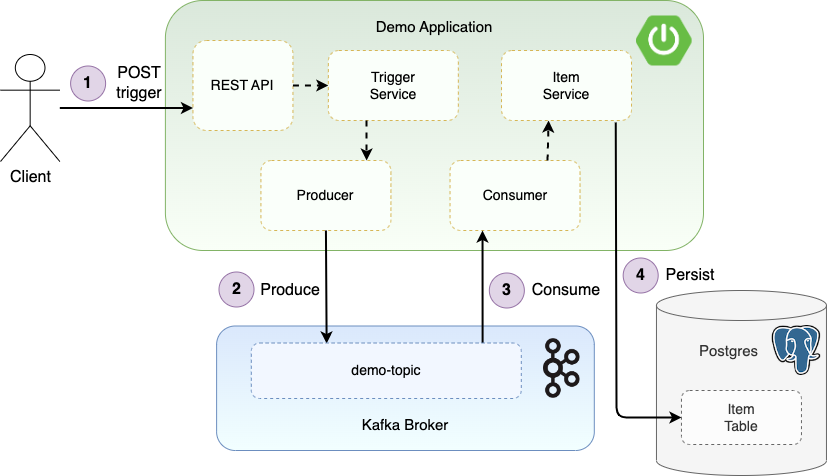
The Spring Boot application provides a REST endpoint that enables a client to trigger the application to send events to Kafka continually for a specified period of time. The application then consumes these events, and for each one it performs a write to the database.

This application therefore facilitates generating a large amount of traffic both in the terms of Kafka events and Postgres writes, which in turn enables demonstrating the monitoring and alerting on the resulting metrics. To enable the export of metrics from the application simply include the Spring Actuator and Micrometer dependencies in the maven pom.xml. Export of metrics are enabled in the application.yml file:
management:
   endpoints:
       web:
           exposure:
               include: "*"
   endpoint:
       metrics:
           enabled: true
   metrics:
       export:
           prometheus:
               enabled: true
Spring Kafka adds further timers to the metrics that Micrometer exports, for the container listeners and the KafkaTemplate (which is used to send events to the broker). Additionally, listeners can be added to the application consumers and producers in the application configuration to enable metrics on these too. These metrics, scraped by Prometheus, then become available in Grafana when building dashboards enabling performance of the listeners to be observed.
Monitoring Kafka And Postgres
In order to scrape metrics from Kafka and Postgres, an exporter is run for each. Prometheus is then able to connect to the exporter endpoints to ingest these metrics, which in turn are made available for display in Grafana. The exporters themselves are running in docker containers for the demo.
The Kafka exporter used in this demo is the danieljs exporter. The Postgres exporter used is the Prometheus community exporter.
Summary
Prometheus, Grafana and Alertmanager are three tools that combined provide the backbone for the monitoring and alerting of a system. A Spring Boot application is provided that can generate a large volume of events and database writes. In the second part of the series this will be used to demonstrate monitoring the metrics of the Kafka messaging broker, the Postgres database, and the Spring Boot application itself using metric exporters, Prometheus and Grafana.
- Part 1: Monitoring And Alerting Introduction (this part)
- Part 2: Monitoring Demo
- Part 3: Alerting Demo
Source Code
The source code for the accompanying monitoring demo application is available here:
https://github.com/lydtechconsulting/monitoring-demo/tree/v1.0.0.


