Introduction
In this second part of the series on monitoring and alerting with Prometheus, Grafana and Alertmanager, the configuration required for Prometheus is covered. The monitoring demo is stepped through, with the Spring Boot application used to generate events that are written to Kafka, and writes to the database. The metrics being scraped by Prometheus are observed, and dashboards are configured in Grafana to surface the data.
This is section two of three parts in this series on monitoring and alerting:
- Part 1: Monitoring And Alerting Introduction
- Part 2: Monitoring Demo (this part)
- Part 3: Alerting Demo
The companion repository that contains all the configuration and resources to run the monitoring demo, along with the Spring Boot application itself, is available here.
Monitoring Configuration
Prometheus is configured via the prometheus.yml properties file. Each scrape target is defined, for example the Kafka exporter configuration is:
- job_name: kafka
 static_configs:
   - targets: ['kafka-exporter:9308']
This file also contains a pointer to the alerting rules to use:
rule_files:
 - rules.yml
And the URL to reach Alertmanager:
alerting:
 alertmanagers:
   - static_configs:
       - targets: ['alertmanager:9093']
The rules.yml and alertmanager.yml configuration files are covered in a later section.
Monitoring Demo Walkthrough
Build Application
The Spring Boot application docker image should be built:
mvn clean install
docker build -t monitoring-demo-app .
This image will be used when the docker containers are started in the next step.
Start Containers
Docker compose is used to determine the containers to start. This uses the configuration specified in docker-compose.yml. This includes specifying which configuration files (prometheus.yml, alertmanager.yml, rules.yml) to mount on which containers.
The Spring Boot application, Kafka, Zookeeper, Kafka exporter, Postgres, Postgres exporter, Prometheus, Grafana and Alertmanager docker containers are started with:
docker-compose up -d
The containers can then be observed to be running, for example via Docker Desktop:

Prometheus
The exported targets, as configured in prometheus.yml, can now be viewed in Prometheus:
- Navigate to http://localhost:9090
- Select the 'Status' dropdown and then 'Targets'.

The raw metrics can be observed by clicking on the target links, although note that the host name needs to be changed to localhost. Note too that Prometheus itself has also been set up as a scrape target, so its health and performance can be monitored.
Grafana
Grafana must be configured to point to the Prometheus data source:
- Navigate to http://localhost:3000
- Login with the default credentials that have autocompleted.
- Go to 'Connections' / 'Data sources' / 'Add data source' - select 'Prometheus'.
- Enter the Prometheus URL: 'http://prometheus:9090' as the Connection URL.
- Click 'Save & test'.
Example dashboards that provide charts and graphs showing key metric data for the different resources can be downloaded from the Grafana website and imported into the tool.
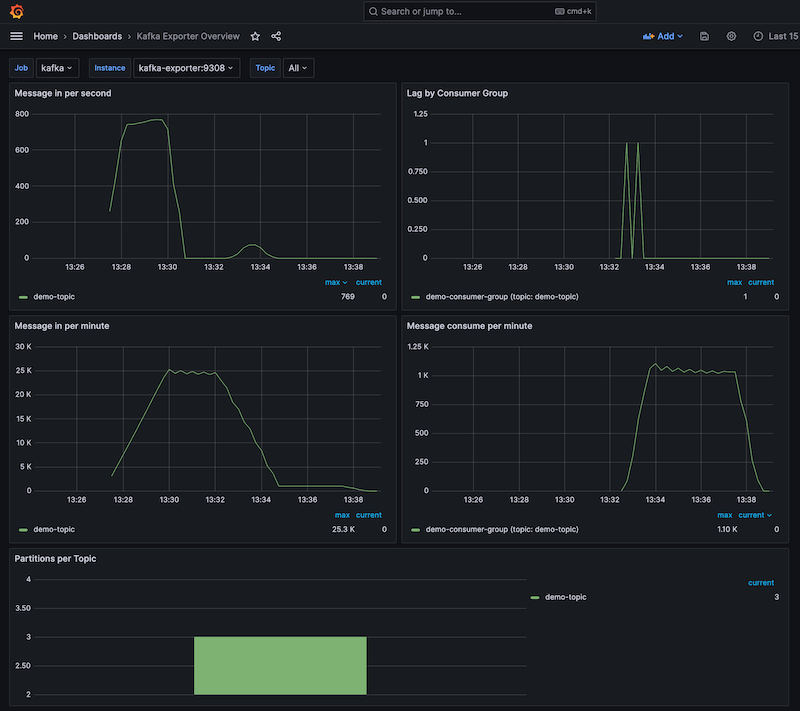
Import example Kafka dashboard:
- Navigate to https://grafana.com/grafana/dashboards/7589-kafka-exporter-overview/
- Download JSON. (Also available in this project at ./dashboards/kafka_7589_rev5.json).
- Under 'Dashboards' select 'Create Dashboard' / 'Import dashboard'.
- Select 'prometheus' as the datasource and import.
Import example Postgres dashboard:
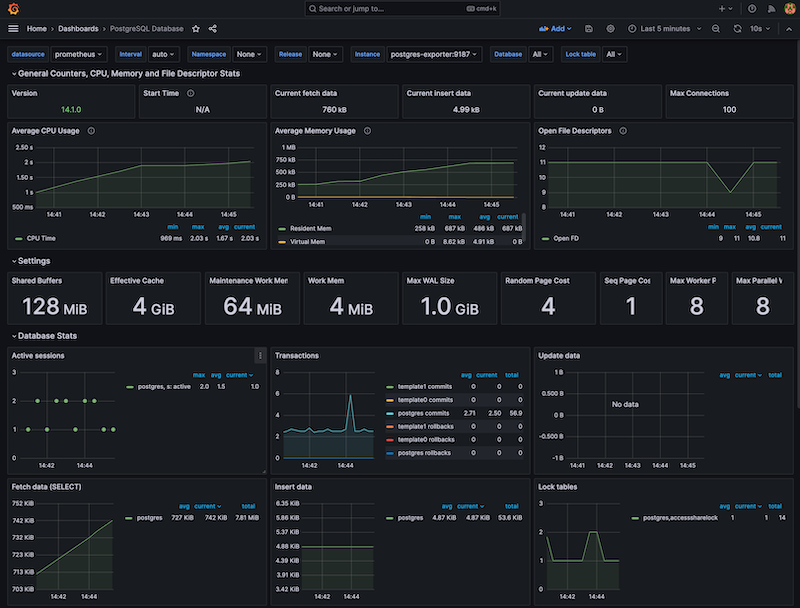
- Navigate to https://grafana.com/grafana/dashboards/9628-postgresql-database/
- Download JSON. (Also available at ./dashboards/postgres_9628_rev7.json)
- Import as above.
Import example Alertmanager dashboard:
- Navigate to https://grafana.com/grafana/dashboards/9578-alertmanager/
- Download JSON. (Also available at ./dashboards/alertmanager_9578_rev4.json)
- Import as above.
Import example Spring Boot application dashboard:
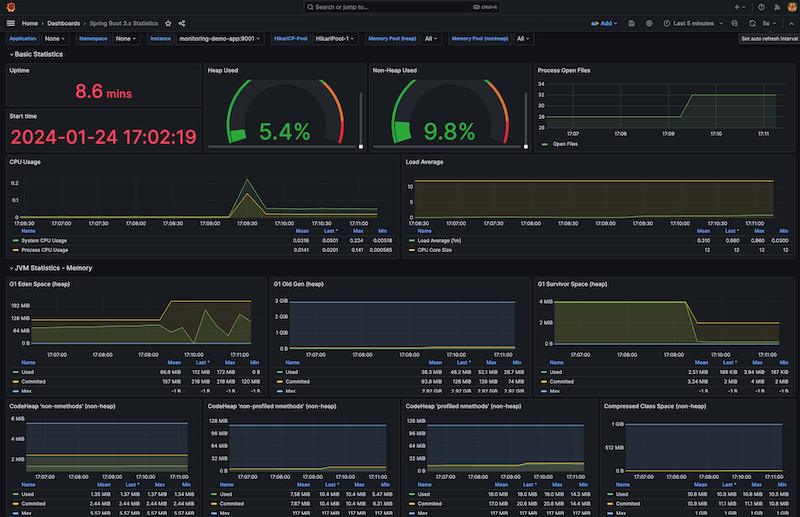
- Navigate to https://grafana.com/grafana/dashboards/19004-spring-boot-statistics/
- Download JSON. (Also available at ./dashboards/springboot_19004_rev1.json)
- Import as above.
Generate Metrics
Call the REST endpoint provided on the Spring Boot application to trigger sending events, specifying the period to send events for, and the delay in milliseconds between each send:
curl -v -d '{"periodToSendSeconds":60, "delayMilliseconds":100}' -H "Content-Type: application/json" -X POST http://localhost:9001/v1/trigger
Note that the application's Kafka producer has a linger.ms configuration value of 3 milliseconds, so applying a delay shorter than this will result in batches of events being produced.
View Metrics
Navigate to the imported dashboards to view the state of the components in the system.
The Spring Boot dashboard surfaces metrics on CPU, memory, garbage collection, as well as REST request/response times and database connections.

The Kafka dashboard provides an overview of message consumption rates, including consumer group lag.

The Postgres dashboard visualises detailed metrics on aspects from CPU and memory usage to query sizes, locks and sessions.

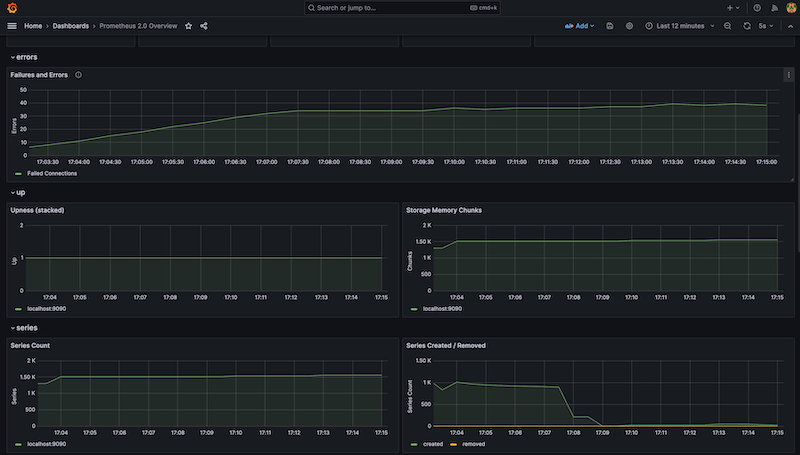
The Prometheus dashboard provides an insight into its health, CPU and memory usage, the number of errors or failures reported, and metrics on the scraping that it is performing.

Summary
Prometheus scrapes metrics from target resources storing it as time series data. This is then queried by Grafana and surfaced in graphs and charts in dashboards. This second part of the monitoring and alerting article stepped through the demo showing this in action. It utilised the companion Spring Boot application to generate traffic that allowed the resultant metrics from the resources in the system, including Kafka and Postgres, to be monitored. In the third part of the series rules will be configured that will result in alerts being raised by Alertmanager.
- Part 1: Monitoring And Alerting Introduction
- Part 2: Monitoring Demo (this part)
- Part 3: Alerting Demo
Source Code
The source code for the accompanying monitoring demo application is available here:
https://github.com/lydtechconsulting/monitoring-demo/tree/v1.0.0.


