
Rob Golder - September 2024

Graylog is a logging system that ingests logs, provides search and filter options, and the ability to configure dashboards and alerts. Graylog, its architecture and usage is covered in the first part of this two part series. In this second part the companion Spring Boot application is used to generate application logging that is ingested by Graylog, and alerting is configured notifying Slack. The Spring Boot application is available here.
The demo consists of a Spring Boot application that generates logs, which are sent to Graylog. Version 5.2 of Graylog is used, and this introduces the new Graylog Data Node which provides Opensearch for the storage and searching of logs. Graylog also depends on MongoDB for storing config. All these components of the system are started in their own docker containers.
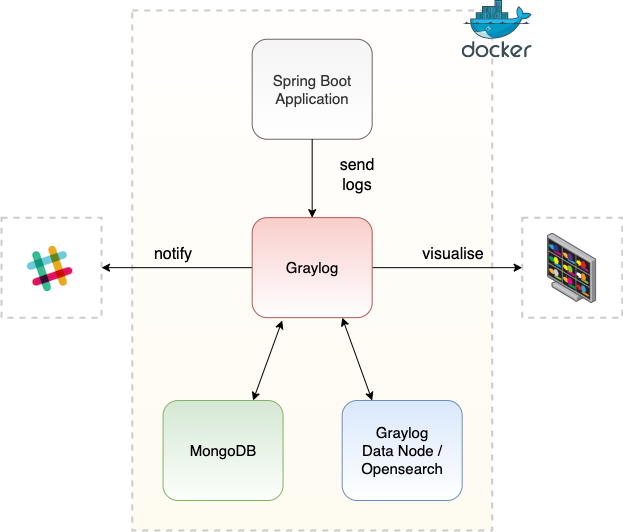
Figure 1: Graylog demo
The Graylog UI is used to view the log messages, and an alert is configured to notify a Slack channel when an ERROR log is received.
The Spring Boot application provides a REST API that exposes two simple GET endpoints. One results in an INFO message being logged, and the one results in an ERROR message being logged.
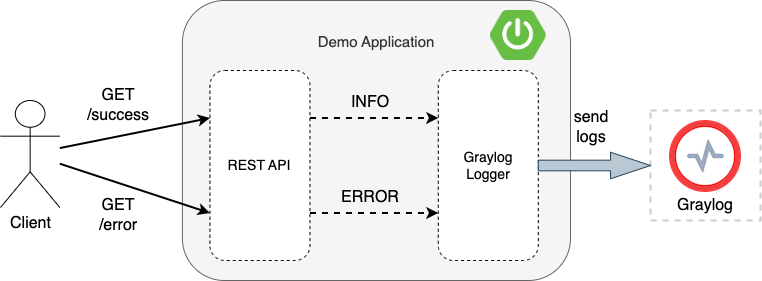
Figure 2: Spring Boot application
The endpoints are defined in DemoController. For example, the /success endpoint is defined as:
@GetMapping("/success")
public ResponseEntity<Void> success() {
    log.info("REST request received successfully");
    return ResponseEntity.accepted().build();
}
The controller is annotated with the Lombok library’s @Slf4j annotation to generate the logger class that is used to output logs, without the need for additional boilerplate code.
The appender is responsible for delivering the log messages to the required destination, in this case Graylog. Graylog officially supports the log4j logging framework, although any logging framework can be used to send messages to Graylog. The alternatives have library support through the Graylog marketplace, however note that these are not maintained by Graylog. For this demo the Spring Boot application is using logback. The de.siegmar Graylog logging library can be used to provide the Graylog logback appender. Add this dependency to the maven pom.xml:
<dependency>
   <groupId>de.siegmar</groupId>
   <artifactId>logback-gelf</artifactId>
   <version>5.0.1</version>
</dependency>
The logback.xml then defines the appender to use. For the demo the GelfTcpAppender is configured.
<appender name="GELF-TCP" class="de.siegmar.logbackgelf.GelfTcpAppender">
   <graylogHost>graylog</graylogHost>
   <graylogPort>12201</graylogPort>
   <encoder class="de.siegmar.logbackgelf.GelfEncoder">
   ... config ...
   </encoder>
</appender>
This uses the TCP delivery protocol. Use the GelfUdpAppender for the UDP protocol. TCP guarantees delivery of messages to Graylog, unlike UDP. A console appender is also configured.
The GELF appender then uses the GELF logging format to send the messages in. As the applications are running in docker containers in the same docker network, the graylogHost is set to the name of the Graylog docker container, along with the exposed TCP port (as defined in the docker-compose.yml) The appender uses the GelfEncoder to specify what should be included in the log messages that are sent. The full set of encoder options are documented here.
For more on the trade-offs between TCP and UDP, and the alternative logging format options, see part one in this series.
The Spring Boot application docker image should be built:
mvn clean install
docker build -t springboot-graylog-app .
This image will be used when the docker containers are started in the next step.
Docker compose is used to determine the containers to start. This uses the configuration specified in docker-compose.yml. The Spring Boot application, Graylog, Graylog Data Node (with Opensearch), and MongoDB docker containers are started with:
docker-compose up -dThe containers can then be observed to be running via the command:
docker psOutput:

Figure 3: Docker containers running
Navigate to the Graylog web UI:
http://localhost:9000/The initial credentials to log in to Graylog are output in the Graylog container logs. View these logs with:
docker logs -f graylogFor example, logging shows:
Initial configuration is accessible at 0.0.0.0:9000, with username 'admin' and password 'KmIvzhoGXr'.This logs in to the Preflight UI which is used to complete the initial configuration and secure the data node, which are required steps. Set up the certificate authority for the integration with the Graylog datanode by clicking: Create CA / Create Policy / Provision certificate and continue / Resume startup. This step only needs to be completed the first time.

Figure 4: Graylog Data Node Preflight UI
Now login to Graylog with admin / admin, which are the credentials defined in the docker-compose.yml.
The GELF TCP input must be configured, which will ingest the logs from the Spring Boot application. The input is created via: System / Inputs / Select input - select GELF TCP (in line with the appender defined in the logback.xml appender) / Launch new input / Enter name / Select Global checkbox / Launch Input.

Figure 5: GELF TCP input
Generate an INFO logging message by calling the success Spring Boot application REST endpoint:
curl http://localhost:9001/v1/demo/successView the log message in Graylog by navigating to the Search window. To display the logging level, select FIELDS on the left menu / level_name / Add to all tables.
The following screenshot shows multiple application log messages having been consumed by Graylog:
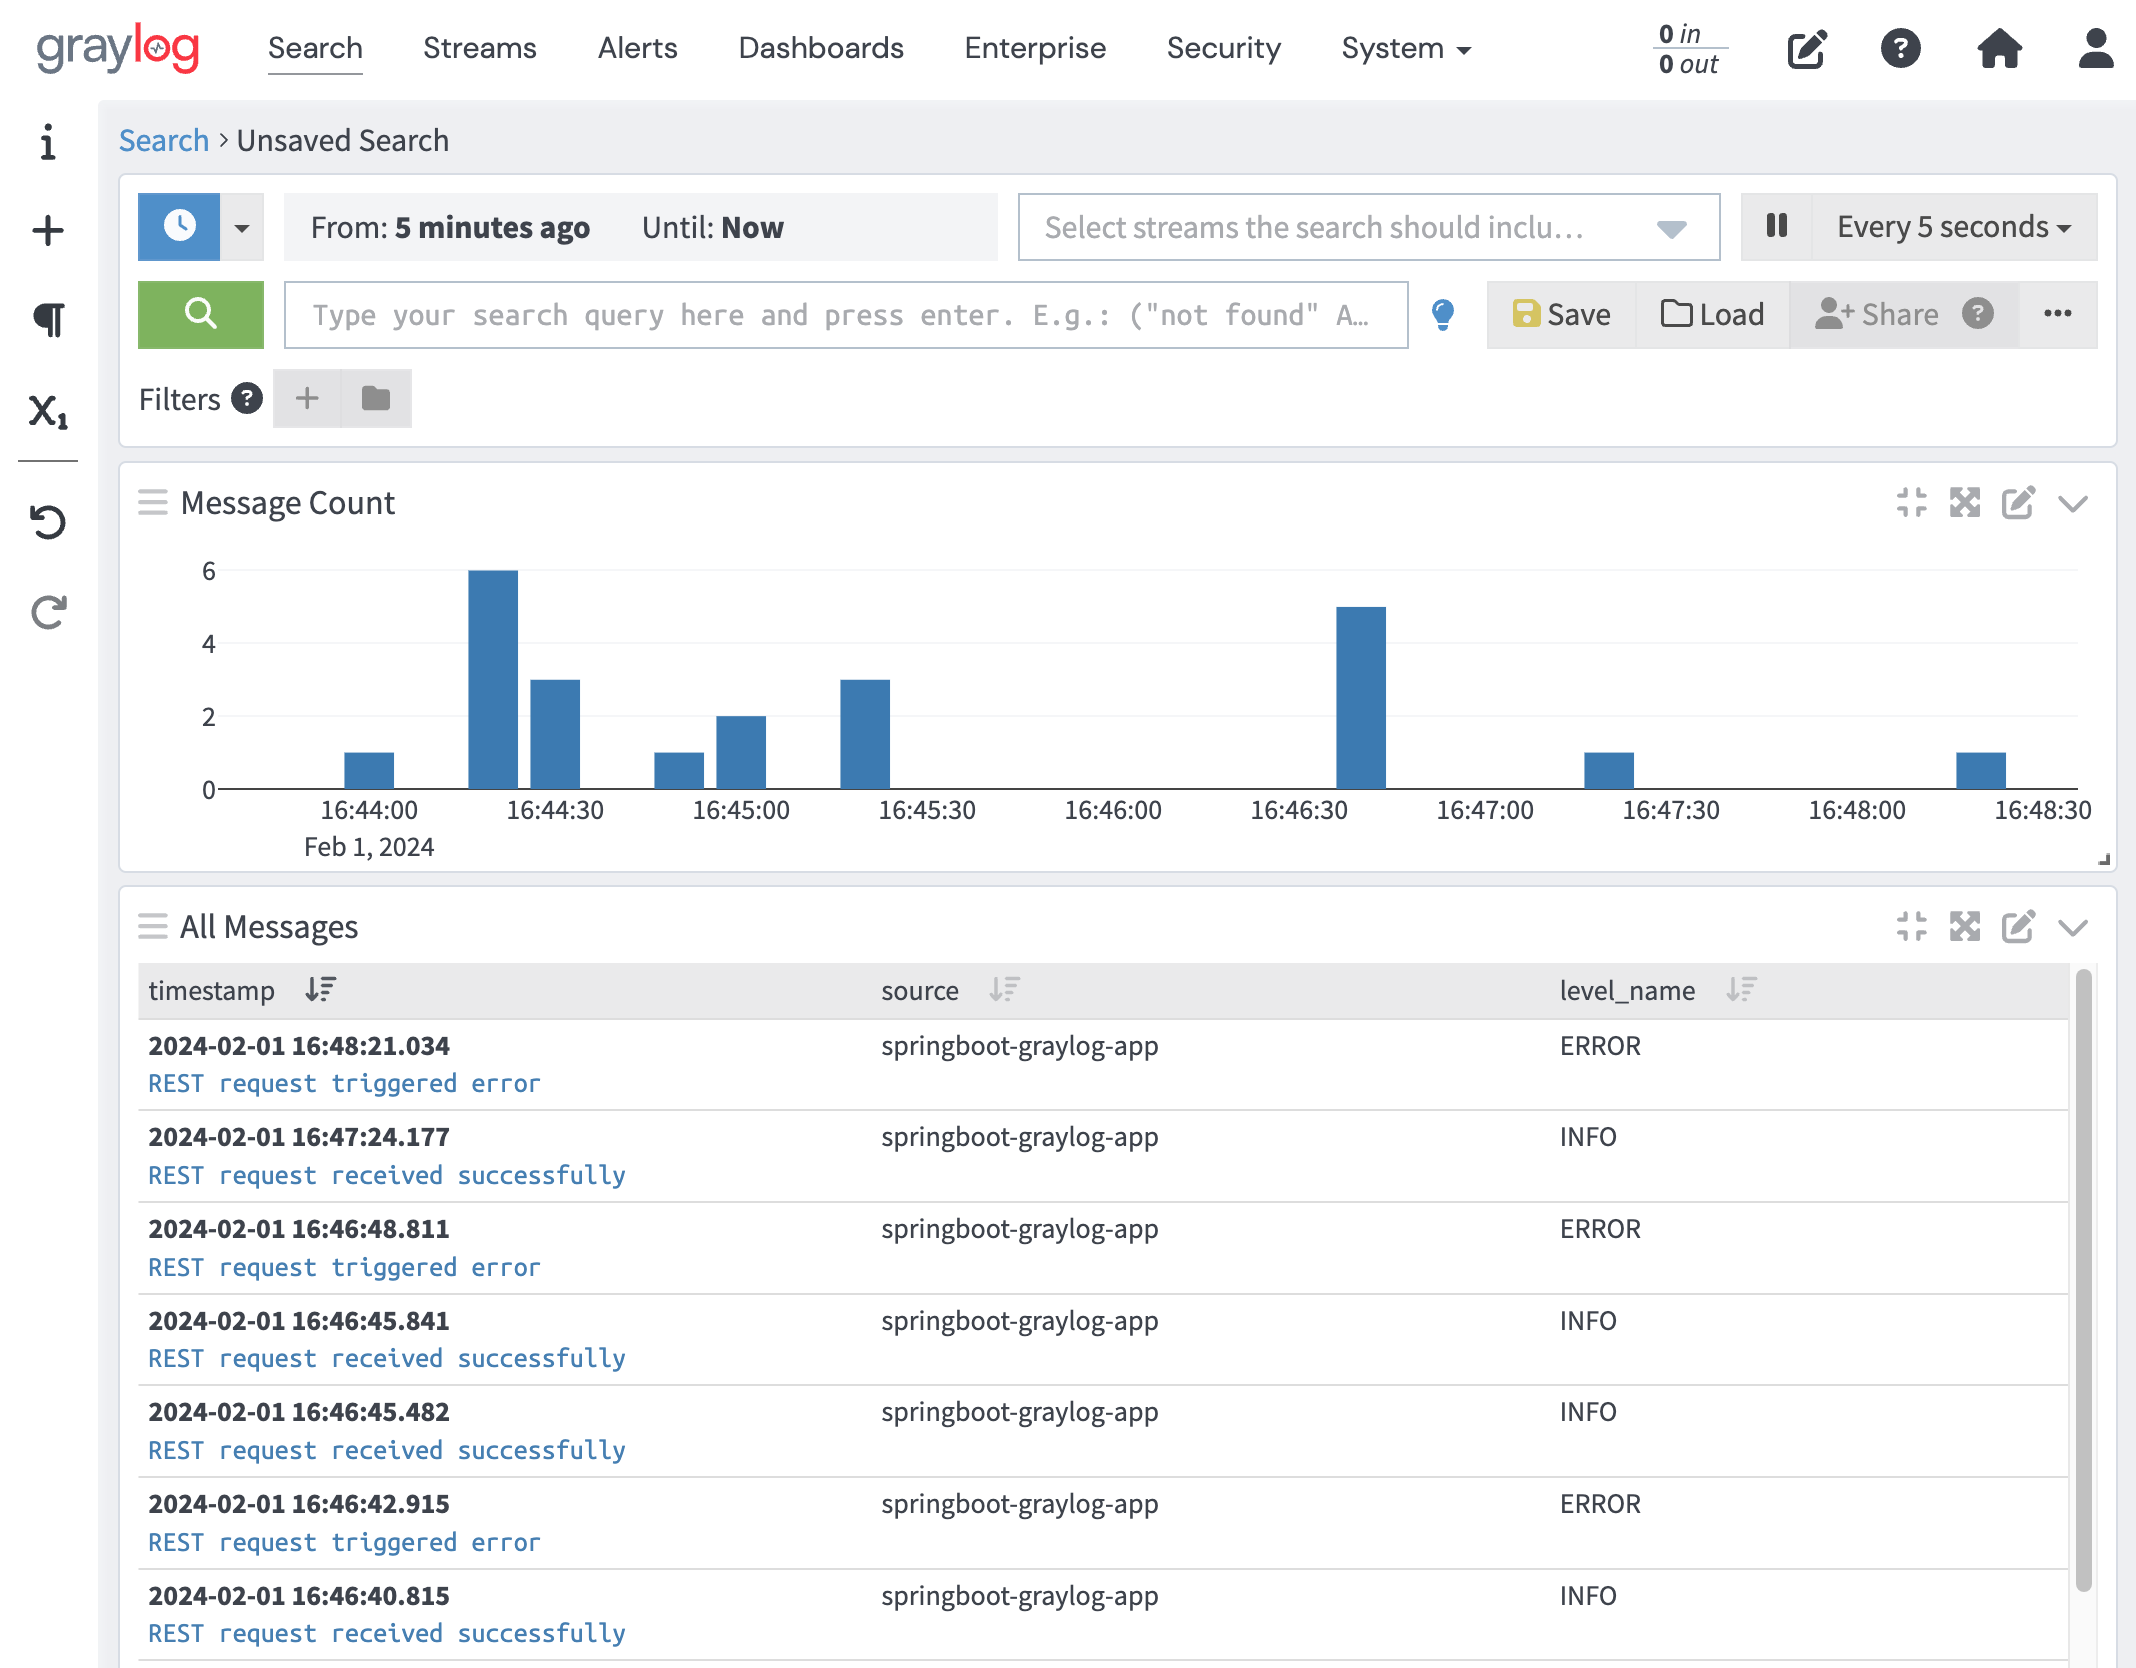
Figure 6: Log messages in Graylog
For this part of the demo an alert notification is sent to Slack when an ERROR log message is ingested by Graylog. A Slack webhook endpoint must first be configured for the Slack workspace in use. Instructions on configuring the webhook are available in the Slack documentation.
In the Graylog UI under the Alerts menu step through first creating a Notification. Select the notification type of Slack Notification and enter the generated webhook URL and Slack channel. Then create an Event Definition. Set the Search query to:
level: <4Ensure the spacing is as above. This means that any log message consumed that is at level 3 (ERROR) or lower will trigger the alert. Ensure the notification created in the previous step is selected, and optionally remove the Grace Period.
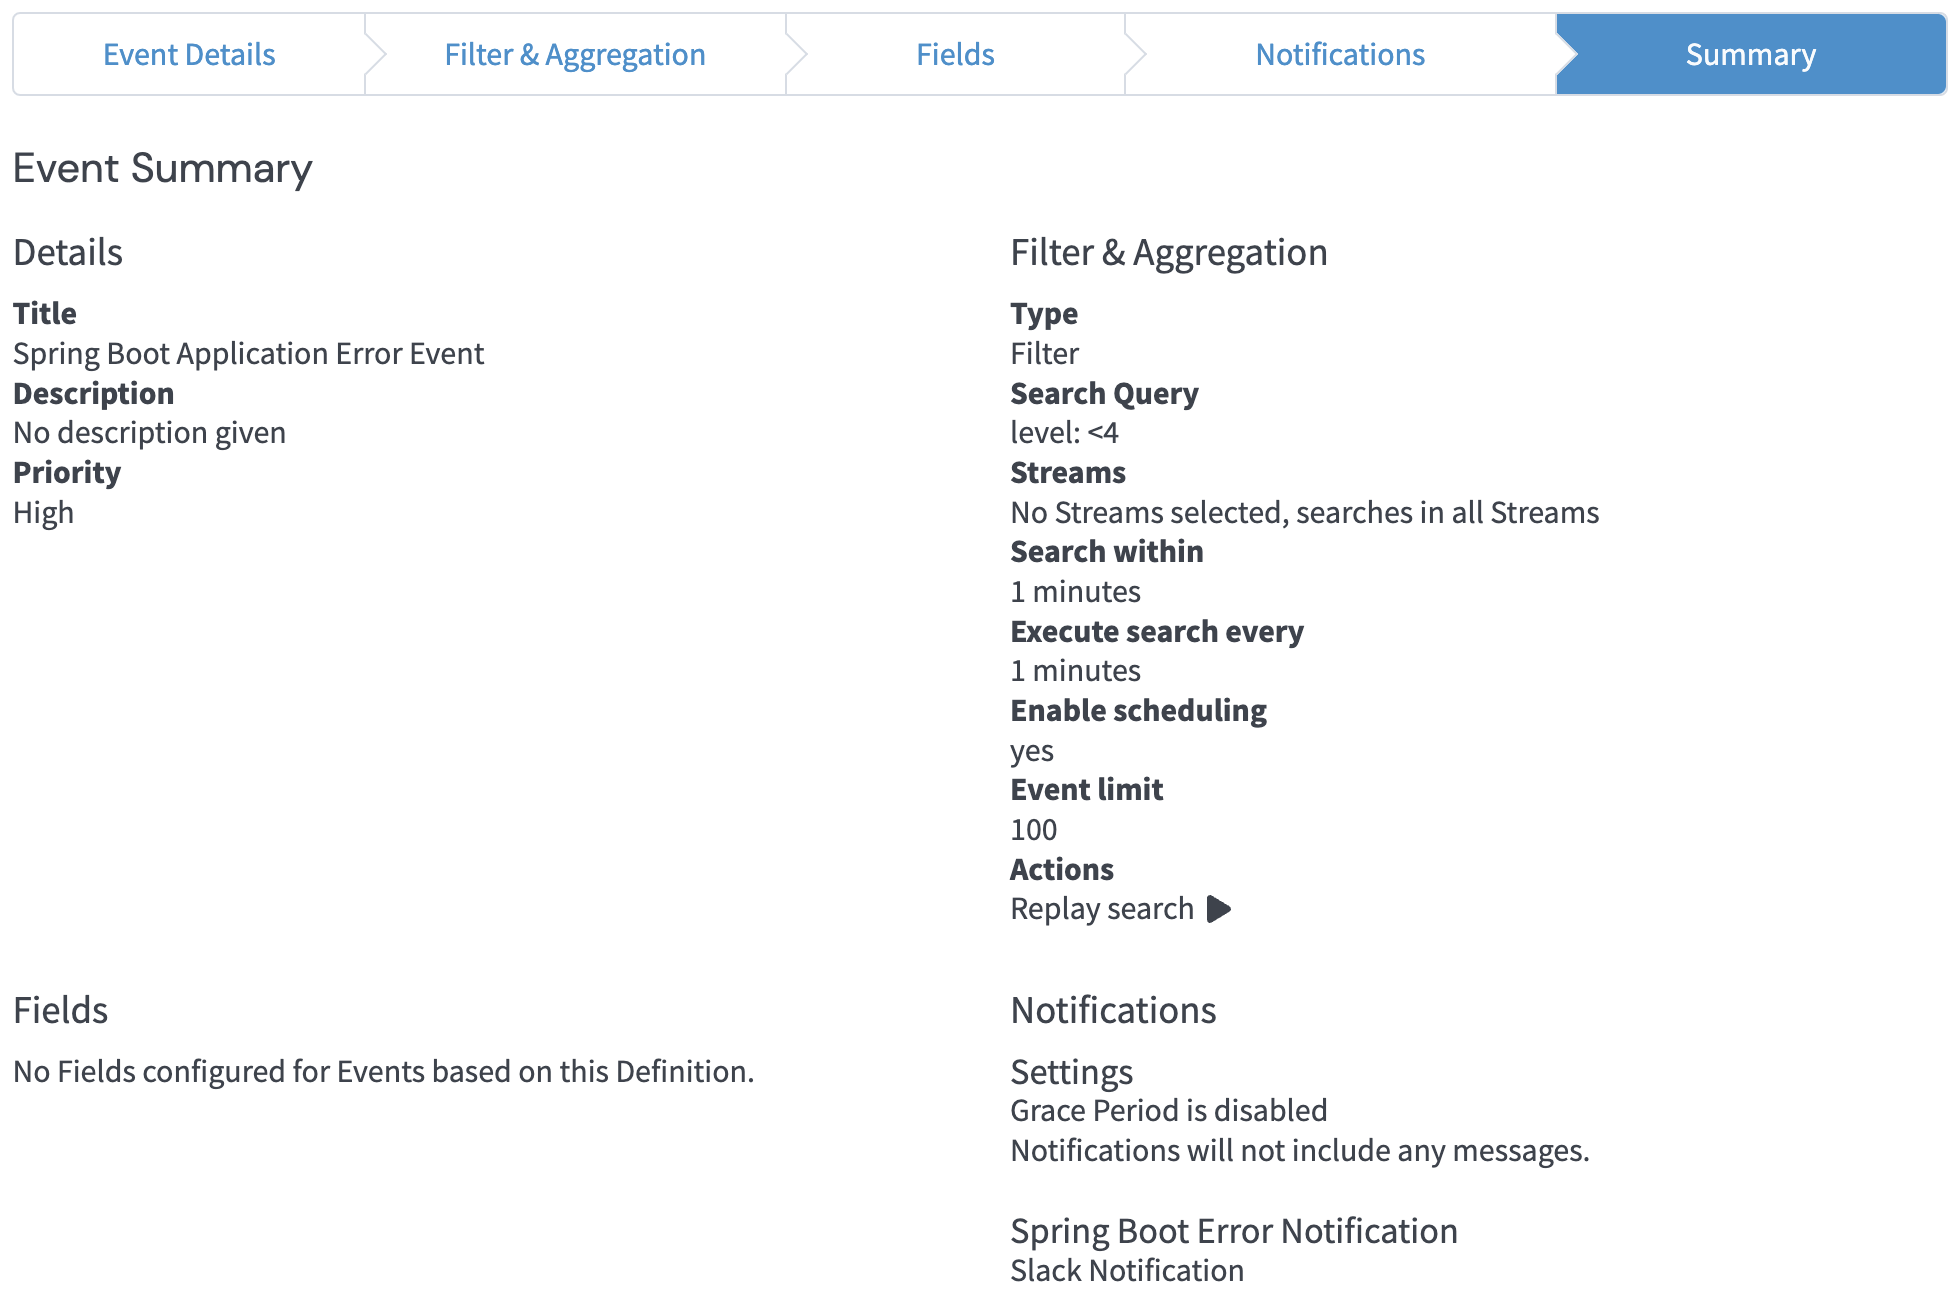
Figure 7: Event configuration
To trigger the alert generate an ERROR by calling the error REST endpoint:
curl http://localhost:9001/v1/demo/errorThe message appears in the Graylog UI, and the event notification can be viewed in the Alerts / Events screen:

Figure 8: Alert notification in Graylog
The notification is sent to Slack:
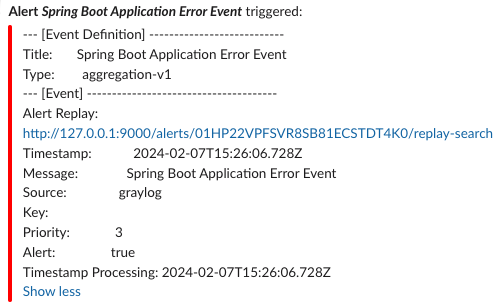
Figure 9: Slack error log alert notification
A Spring Boot application can be easily configured to send logs to Graylog with no code change, but rather by applying the appropriate appender in the logging configuration. Log messages can be sent via the TCP or UDP protocols. There are different options to choose for the format of the messages, with the GELF format being designed by Graylog to be structured and efficient. Graylog itself is architected to scale to handle huge volumes of log data, providing the storage and search facilities, a UI to surface the logs, and an alerting mechanism to notify a wide range of destination targets such as Slack, email, and PagerDuty.
The source code for the accompanying application demonstrating sending logs to Graylog is available here:
https://github.com/lydtechconsulting/springboot-graylog/tree/v1.0.0
View this article on our Medium Publication.